



RSS
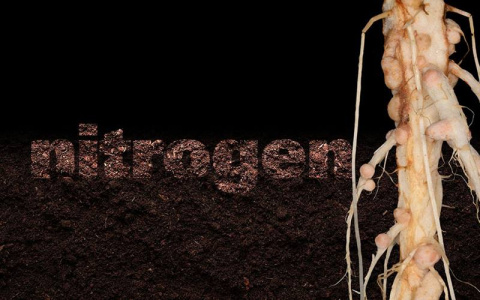


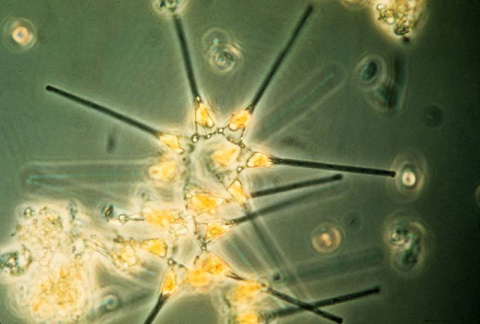
Scientists develop a molecular map of metabolic products of bacteria in root nodules to aid sustainable agriculture.
Technique enables efficient & precise estimates of trends in ozone & other atmospheric constituents within selected geographical regions & timeframes.
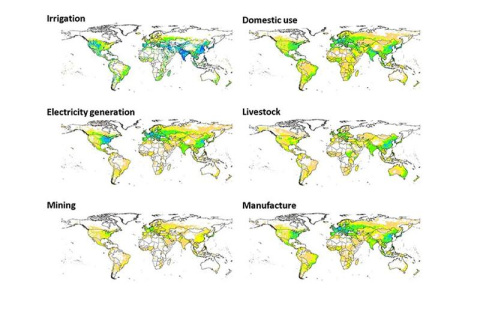
Global data set shows monthly water use by irrigation, manufacturing, and other uses, helping researchers to analyze water use by region and season.
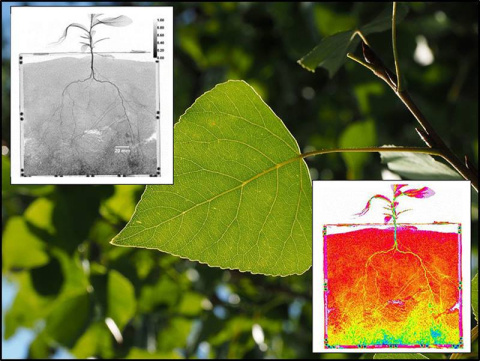
Researchers link root water uptake to root traits and assess (poor) performance of common models.
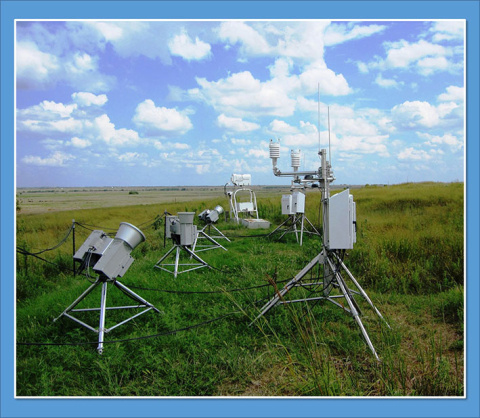
Predictions of the direct impacts of greenhouse gases must account for local temperature and humidity conditions.
Surface measurements of rain drop sizes shed light on cloud processes and cloud types.
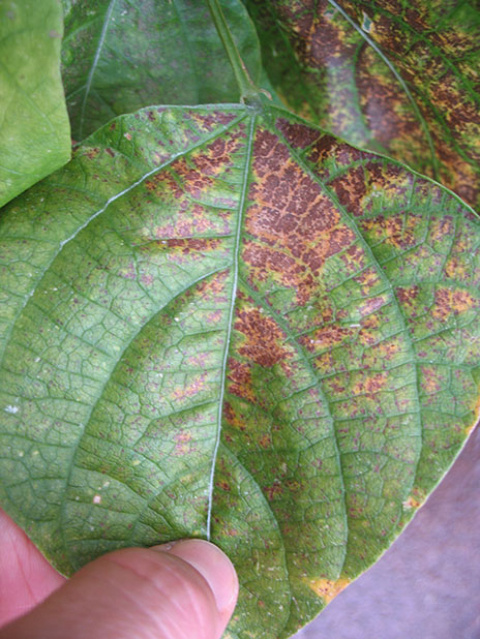
Research offers evidence that microbes and organic matter raise toxin levels, potentially helping improve mercury monitoring.
Researchers find gusty winds increase surface evaporation that drives summer rainstorms in the Tropical West Pacific.
Nutrients increasingly moving to the deep ocean with strong climate warming could lead to drastic drops in surface ocean life and fishery yields.
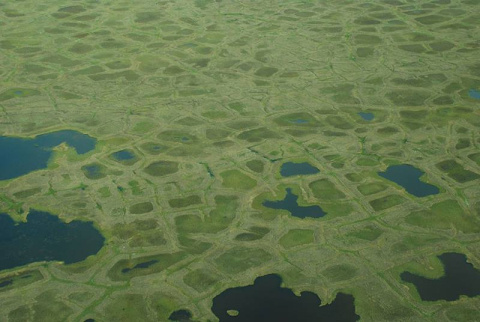
Soil moisture is key to determining plant growth and nutrient cycling in complex tundra landscapes.