
Researchers supported by the Department of Energy are delving into the cosmic microwave background to better understand the early universe.
November 5, 2026 Estimated Read Time min
Shannon Brescher Shea

Shannon Brescher Shea (shannon.shea@science.doe.gov) is the social media manager and senior writer/editor in the Office of Science’s Office of Communications and Public Affairs. She writes and curates content for the Office of Science’s Twitter and LinkedIn accounts as well as contributes to the Department of Energy’s overall social media accounts. In addition, she writes and edits feature stories covering the Office of Science’s discovery research and manages the Science Public Outreach Community (SPOC). Previously, she was a communications specialist in the Vehicle Technologies Office in the Office of Energy Efficiency and Renewable Energy. She began at the Energy Department in 2008 as a Presidential Management Fellow. In her free time, she enjoys bicycling, gardening, writing, volunteering, and parenting two awesome kids.
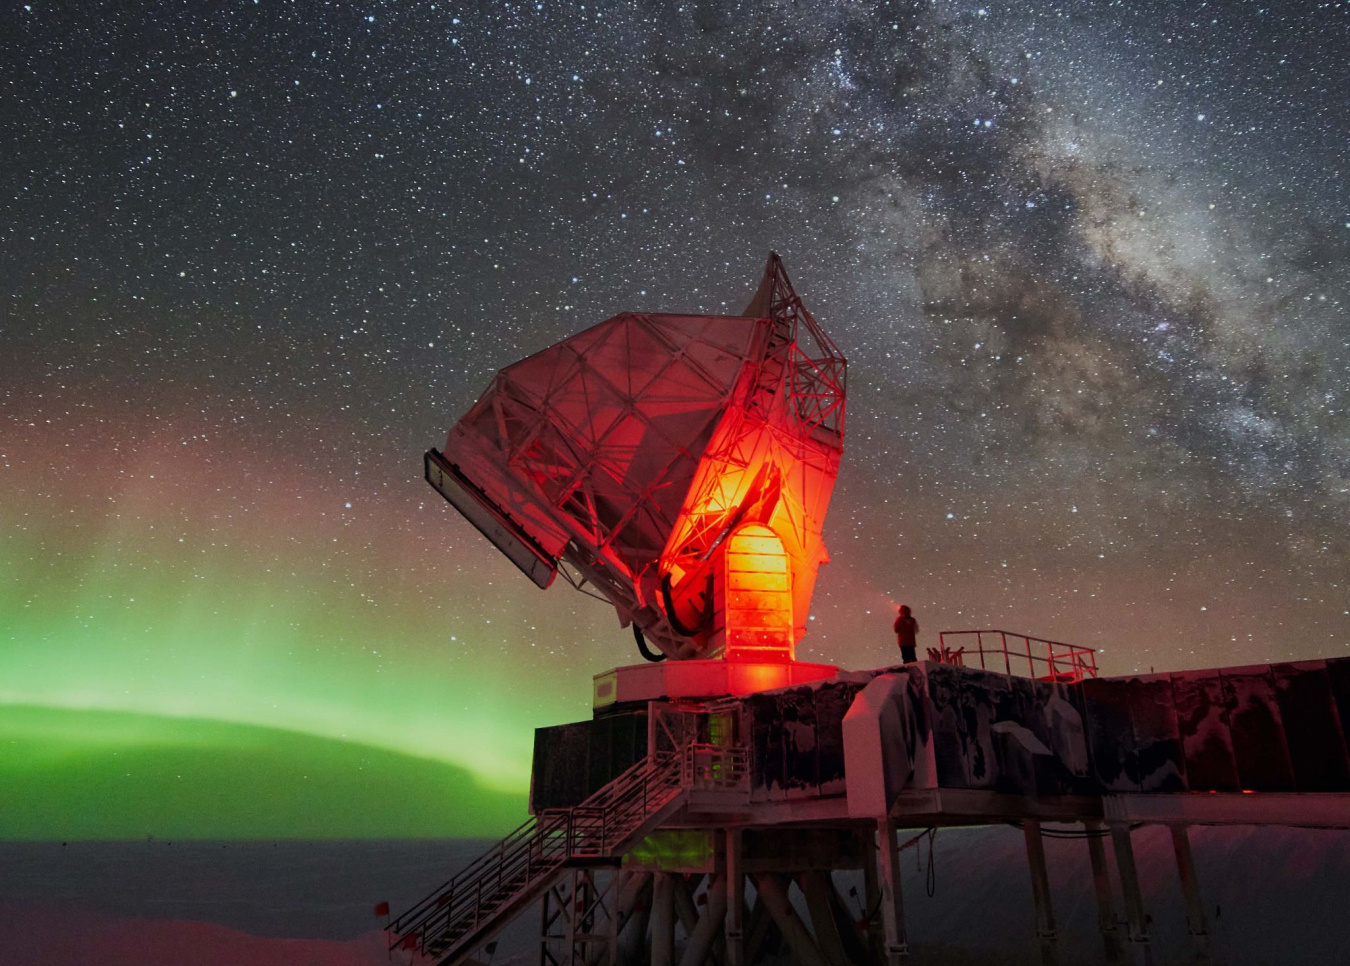
A figure in red trudges across a blanket of white. Snow squeaks under the scientist’s feet, too dry to be slick or soft. Only a line of flags and a few large buildings – the scientist’s destination – break up the landscape. The sun hovers on the horizon, never quite setting against a blue sky devoid of clouds.
This is summer at the bottom of the world.
In addition to ice and snow, Antarctica hosts the South Pole Telescope (SPT) and BICEP projects. Researchers use these experiments – supported by the U.S. Department of Energy’s (DOE) Office of Science, the National Science Foundation, and their partners – to investigate the earliest moments of the universe. As we can’t travel back in time, astrophysicists use the telescopes at the U.S. National Science Foundation Amundsen-Scott South Pole Station to examine heat left over from early in the universe’s evolution. Combining data from the SPT, BICEP, and other telescopes allows them to sort through competing electromagnetic signals. One elusive signal in particular – the B-mode signal in the polarization of the cosmic microwave background – could help us understand the very beginning of existence.
After the Big Bang
In the beginning, the universe was unimaginably small, dense, and hot. Literally everything that became our observable universe was contained in a volume much tinier than an electron.
Then, the universe expanded faster than the speed of light.
Before the universe’s first trillionth of a trillionth of a second, it grew exponentially, expanding from a region smaller than a proton to a patch around the size of a marble. While the exact size depends on details that physicists haven’t yet pinned down, we do know that even at that tiny size, it was drastically different than its previous form. This inflation radically smoothed and flattened out space, leaving it mostly empty. There was almost nothing left but the energy of the field that drove the expansion.
Almost immediately, the universe changed again. The energy that led to the drastic expansion started transforming into matter. This energy converted into a hot, dense soup of fundamental particles. This soup included the quarks and gluons that are the building blocks of matter today. The universe continued to expand and cool. About ten millionths of a second later, the quarks and gluons joined together into the protons and neutrons that make up atoms.
All of this happened within the first second of the timeline of our universe. Within that single second, the universe grew from smaller than an electron to being more than 100 trillion miles wide.
The extraordinarily fast expansion at the beginning is called inflation and is theorized to be the start of the Big Bang. It is that period of time that scientists seek to understand using the SPT and BICEP telescopes.
A background of light
One of the major signals or observables that scientists use to understand the early universe is called the cosmic microwave background (CMB). It was emitted approximately 380,000 years after that first second of the universe. In those thousands of years, protons and neutrons started combining into early atomic nuclei. The free protons and neutrons scattered light and heat, restricting how radiation could move. The universe was opaque, like a glass of orange juice.
After a period of time, these nuclei began forming atoms, mostly hydrogen. Unlike the ionized gas formed by the free protons and neutrons, these hydrogen atoms did not scatter radiation. Instead, that heat and light escaped. As a result, the universe went from opaque to transparent, where light could move freely.
This light was the CMB.
The CMB still exists today. In fact, it contains the vast majority of photons (particles of light) in the universe. Its energy density is more than all of the light ever created by stars. So why can’t we see it with our eyes or even the strongest optical telescopes?
As the universe has continued expanding, so has the CMB. Imagine a huge quilt. Instead of being on top of a mattress, it’s integrated throughout it. The quilt is the CMB and the mattress is the universe. As the universe mattress expanded in every direction, so did the quilt. As the quilt grew, it stretched out. As our quilt made of light stretches out, its wavelengths get longer and longer. When wavelengths of light stretch out, they move down the electromagnetic spectrum, from visible light to infrared light (what we feel as heat) to microwaves and then radio waves. Today’s CMB is that initial light stretched out to the point of microwaves. Instead of lighting up the night sky, the CMB remains as the faintest of background heat, detectable only with radio telescopes.
Since scientists first detected the CMB in the 1960s, astrophysicists have been studying it as the universe’s “baby pictures” (or with our quilt metaphor, its “baby blanket”).
One of the most important aspects of the CMB is how uniform it is. Across the universe, this background radiation is just below 3 degrees Kelvin. (As the units of the Kelvin and Celsius scales are the same magnitude, this is the same as 3 degrees Celsius.) That means that an object floating between galaxies in the dark could never drop below 3 degrees kelvin, as the CMB would keep it that warm.
But there are tiny ripples in our CMB quilt. These ripples provide important information about that early period of inflation. During inflation, the energy that drove the expansion had quantum fluctuations. These were flickers in the amount of energy at any point in space. As the universe changed, these variations evolved into slight variations in the soup of quarks and gluons. When the CMB emerged, those differences resulted in variations in the CMB’s temperature.
In addition to temperature, there are also slight variations in the CMB’s orientation of light. During those earliest moments, the field that creates gravity was breaking up. Combined with the universe’s expansion, scientists expect that this process created gravitational waves – faint ripples in space-time. The process of inflation would be the only event that could possibly amplify the signal of these primordial gravitational waves. If scientists can detect them, it would be solid evidence in support of inflation.
“It’s one of the ways that we can understand gravity at these very extreme scales,” said Kimmy Wu, an assistant professor at the California Institute of Technology. “The fact that there could be primordial gravitational waves means that at the early fraction of a second when the universe was quantum fluctuations, gravity worked.”
Like the quantum fluctuations, these waves would have left their imprint on the CMB. But instead of slight differences in temperature, this imprint is on the orientation of light. Polarization of light is the orientation of light compared to how it is spreading. Due to how the photons scattered when the CMB formed, the CMB’s polarization is almost perfectly even. How that “perfectly” varies could be a sign of primordial gravitational waves.
Just measuring the polarization at all was a huge accomplishment. John Carlstrom has been studying this phenomenon for his entire career. Currently, he is a professor at the University of Chicago as well as director of the SPT. He led the Degree Angular Scale Interferometer project at the South Pole that detected the CMB’s polarization in 2002.
“We were sitting around with a small team, looking at our computer. There were peaks and wiggles, just as predicted,” he said. “We were just staring at it and it was just phenomenal.”
Making that discovery opened up a new area of research. At that time, astrophysicists were just starting to dig into the idea that the universe was expanding ever more quickly (called “dark energy”). They were also gaining new information about the mysterious substance called dark matter.
As Brad Benson, a physicist at DOE’s Fermi National Accelerator Laboratory (Fermilab), said, “The universe was much weirder than we expected in a lot of ways because of dark energy and dark matter. We wanted to make better measurements and test this model and see if it still held together.”
Tackling research at the bottom of the world
It turns out that Antarctica is the best place for these “better measurements.” To measure the CMB, radio telescopes need to measure wavelengths at the millimeter scale. The South Pole’s high altitude, desert ecosystem, and thin atmosphere make it one of the best places in the world to do so. In fact, the international community has designated the South Pole as a “radio-quiet” zone to preserve its usefulness for radio astronomy.

Antarctica is a unique place for scientists to conduct research as well. After flying to New Zealand, scientists pick up the bulky gear they need to withstand the brutal weather. From there, the United States’ Antarctic Program flies them to the continent on military planes and then on to the South Pole via turboprop planes equipped with skis.
Lindsey Bleem, a physicist at DOE’s Argonne National Laboratory, visited the station in 2008 and 2014. She said, “Antarctica is amazing. It’s such a weird world, to fly over a continent and realize no human has ever walked in these places.”
At the same time, the dryness, altitude, and strange movement of the sun wreaks havoc on scientists’ bodies.
“Your clock gets really messed up by the fact that the sun is always up,” said Carlstrom, describing the Antarctic summer.
It’s even tougher for the scientists known as “winter-overs.” During the winter, no planes fly in and out of the station. The people working at the observatory face exceptionally difficult circumstances for months.
“It really is a team effort to make this all happen,” said Wu. “I’m very appreciative of our winter-overs who make sure our experiments run during that time.”
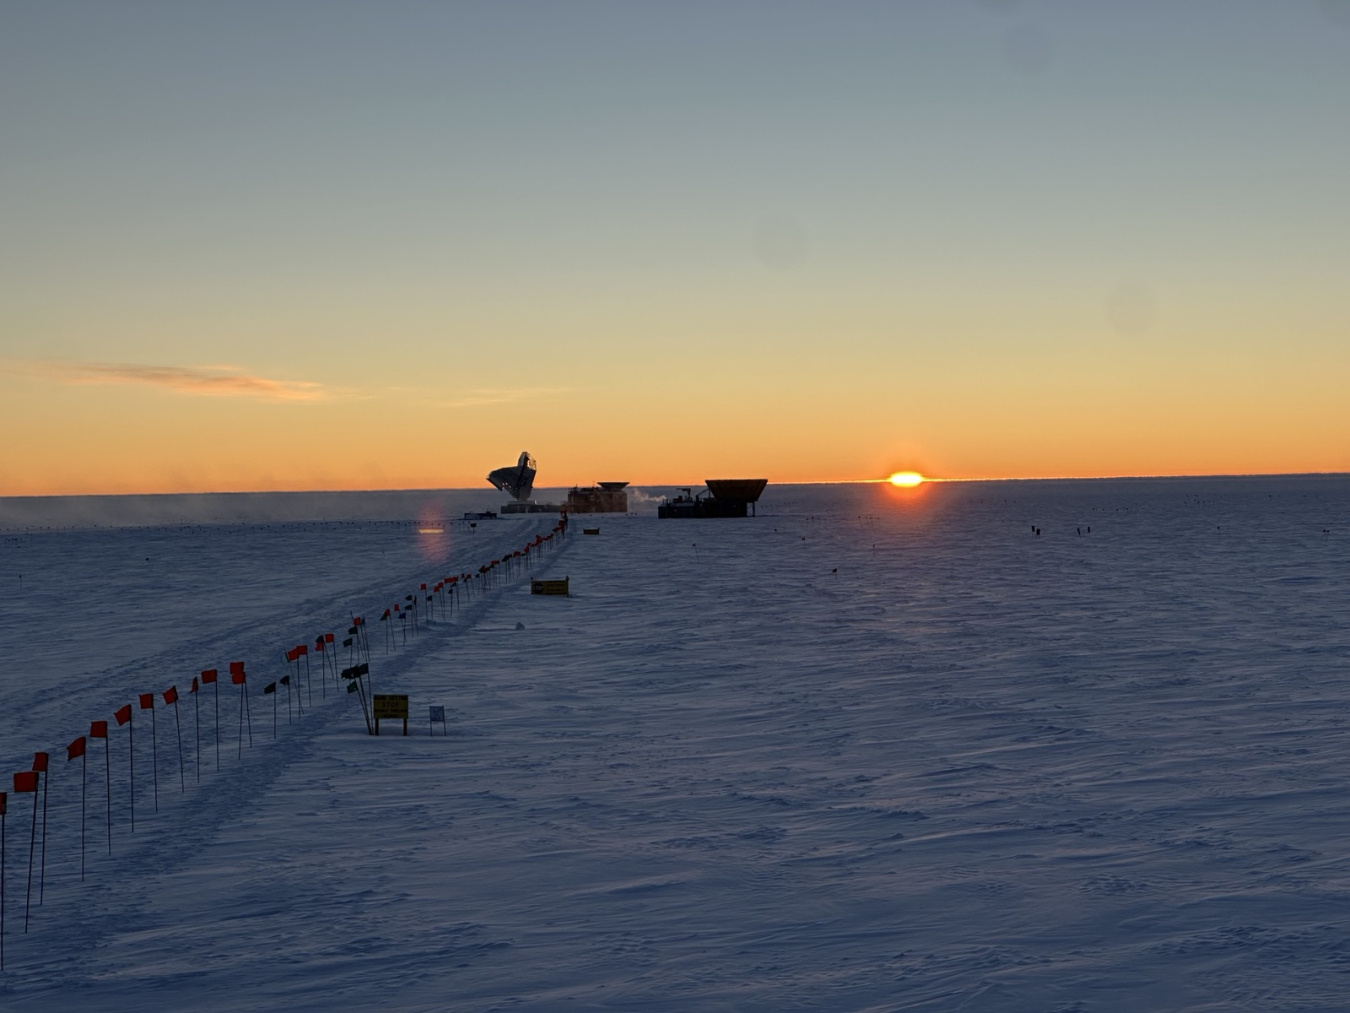
No matter what the season is, the environment makes maintaining the telescope difficult. The extremely low humidity leads to a greater potential for shocking yourself – and the electronics. Working in gloves and mittens makes the simplest tasks an exercise in patience. Snow can pile up and create interference. Being in a remote environment makes it more difficult to get parts.
“You have to plan like you’re putting it in space basically,” said Amy Bender, a physicist at Argonne. "You can’t go get parts at the hardware store.”
Seeing the CMB from Earth and space
To take data at the South Pole, scientists rely on a variety of specialized telescopes.
“Everything we do is 100 percent custom,” said Bender. “The detectors – that’s all developed by us. Designed by us. Made by us and then operated by us. Which is pretty fun.”
Getting the technology right is essential for ensuring reliable and accurate data.
“You have these photons from the CMB that have been traveling for 13.8 billion years. My job is the last microsecond of that journey,” said Zeeshan Ahmed, associate professor at Stanford University and researcher at DOE’s SLAC National Accelerator Laboratory. “If we get that last microsecond wrong, your 13.8 billion years have not helped you.”
South Pole Telescope
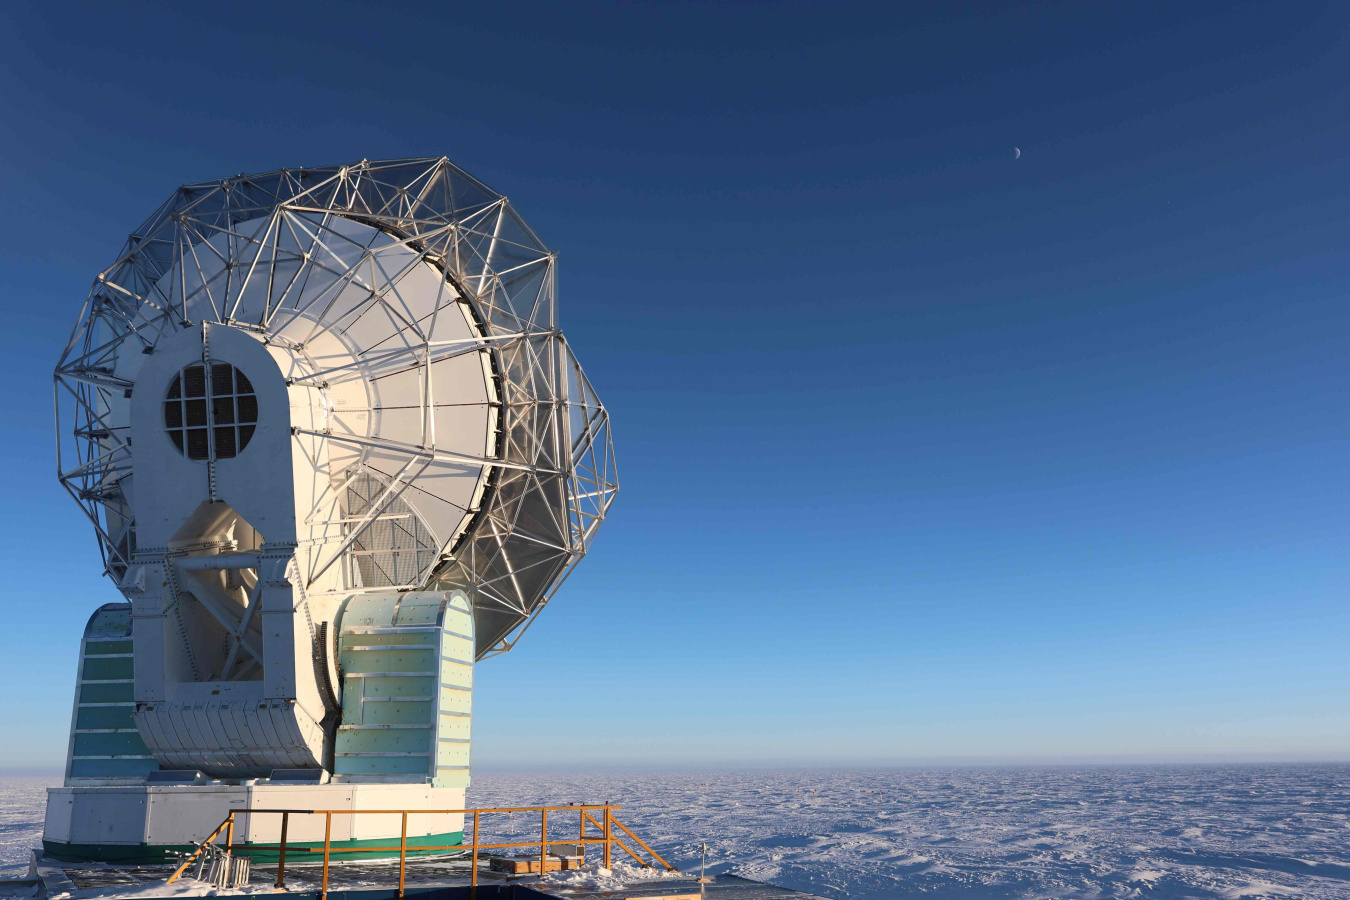
The South Pole Telescope is one of the best telescopes in the world for taking data on the CMB. It has a 10-meter diameter mirror and takes measurements mainly at the millimeter (or microwave) wavelength. Its mirror’s size allows the SPT’s images to resolve arc-minute scales. This is the same resolution as the human eye, although for non-visible light. The machine also has tens of thousands of super-sensitive detectors.
“With this high-resolution data, we can do a lot of really exciting science,” said Bleem.
The SPT is currently on its third major upgrade. Since scientists initially installed it in 2007, it has finished surveys in 2011 (the SPT-SZ original camera) and 2016 (SPTpol).
It’s currently using the SPT-3G camera, which is phenomenal for surveying large areas of the sky. Its low-noise, high-resolution data is excellent for producing maps of the CMB’s polarization.
Scientists have also used the SPT to identify more than 7,000 galaxy clusters. This discovery provides even more insights into dark matter and dark energy. The DOE’s Office of Science supports SPT through work at DOE’s Argonne National Laboratory and Fermilab.
BICEP Collaboration
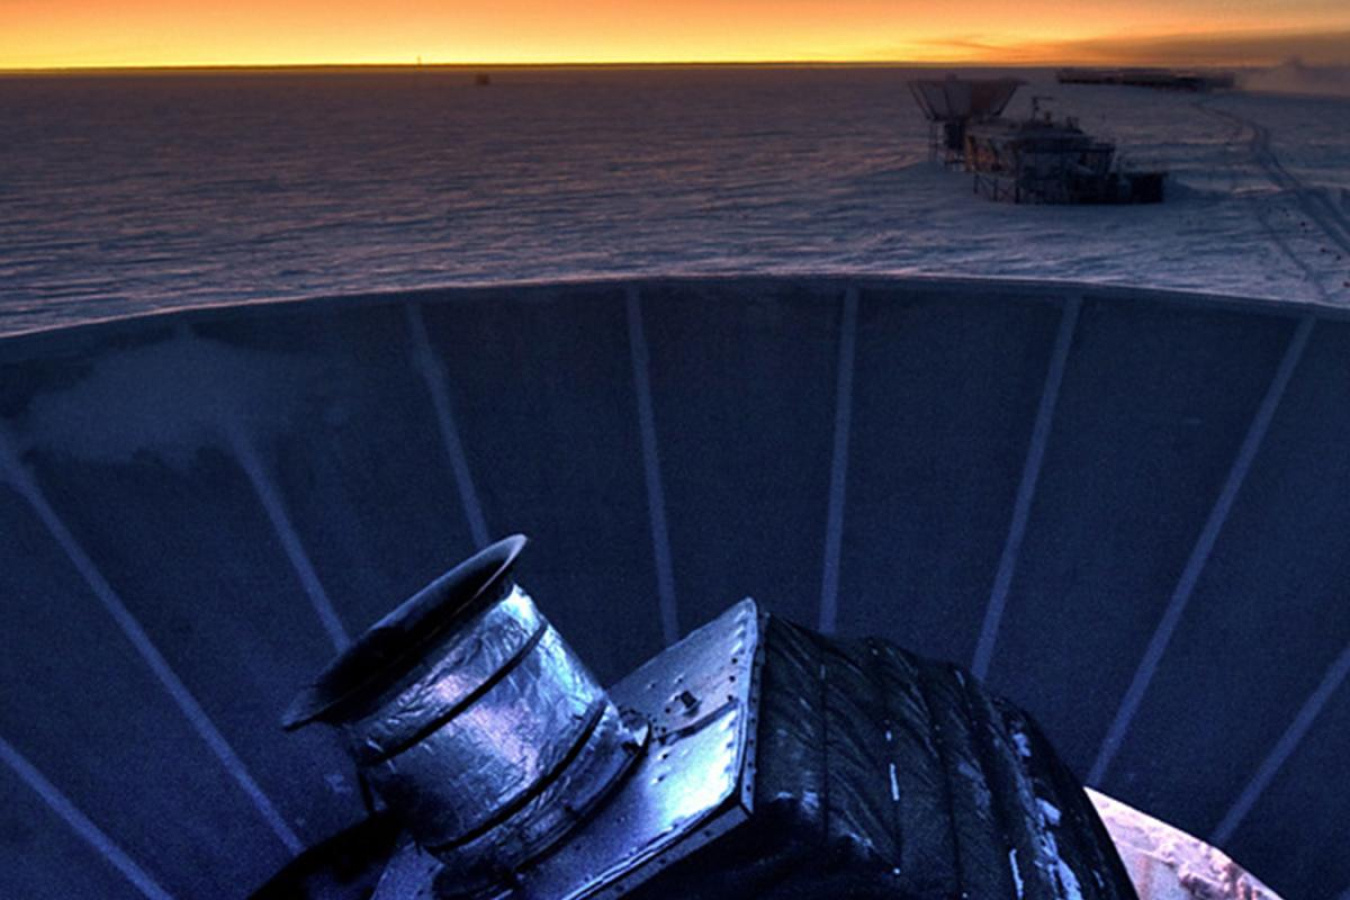
Not far away from the SPT stands the BICEP Array. This set of telescopes specializes in taking data relevant to the primordial gravitational wave signals. Scientists designed it to peer deeply into small parts of the sky. Like the SPT, it gathers information on microwave radiation.
The current set of BICEP telescopes is the fifth generation at this site. It’s largely supported by the National Science Foundation in cooperation with a number of partners, including the DOE’s Office of Science through Stanford University and DOE’s SLAC National Accelerator Laboratory. The first BICEP telescope began taking data in 2006. Currently, both BICEP3 and the BICEP Array are taking data.
Space telescopes
The last tools essential for gathering data on the CMB polarization were actually located in space. The Planck Satellite was run by the European Space Agency from 2009 to 2013. In addition to excellent data on the CMB, Planck gathered information on the “dustiness” of the Milky Way, which is essential for scientists attempting to sort out the signals mixed up with the CMB polarization. Some studies also used data from other space telescopes as well.
Searching for B-Modes
As scientists gathered data from these instruments in the furthest reaches of Earth and beyond, they focused on a set of patterns called “B-modes.”
If primordial gravitational waves exist, they would produce a slight, very specific pattern within the polarization of the CMB. This would be a different pattern than the slight ripples in the temperature. The pattern in the polarization – called B-modes – would provide far more evidence for the theory of inflation than previous observations.
“If we could detect these B-modes robustly, then it’s bulletproof,” said Bleem.
On the other hand, if scientists can’t find evidence of the primordial gravitational wave B-modes, they can eliminate some models of inflation. They may need to revise the model or think about alternatives altogether.
In addition to B-modes in the CMB’s polarization, there are also what scientists call E-modes. Like the ripples in temperature, E-modes come from fluctuations in the density of spacetime at the beginning of the universe.
Both the E and B-modes are much weaker than the ripples in the CMB’s temperature. The E-mode is only one-tenth as strong as the unevenness in temperature and the B-modes are even weaker.
“We are here in the business of making a super, super precise measurement. This is basically a few nanokelvin on top of the 2.725 [degrees] of the CMB,” said Ahmed. It’s like measuring the height of a mountain that’s 10 kilometers tall, but with room for error less than the height of a sheet of paper.
Detecting a pattern that weak is hard enough. But of course, it gets even harder.
For one, there are many other sources of radiation that can be mistaken for the B-modes. “Dust” from our own Milky Way galaxy that polarizes light is a particular issue.
Even more perniciously, there are E-modes that disguise themselves as B-modes. Normally, scientists can tell the difference between the E- and B-modes by the type of pattern. You can imagine the E-modes like straight lines, while the B-modes are swirly.
But as the radiation of the CMB spread out through the universe, the photons in it interacted with the over- and under-densities of large structures. As the CMB photons passed by such large structures, gravity warped the light. As a result, some of the light now “looks” different than it once did. For optical telescopes that take images, this gravitational lensing shows up as galaxies that look distorted. In radio astronomy, it turns some of the CMB E-modes into B-modes. These much stronger B-modes add to the clutter that scientists need to sort through to find the ones associated with primordial gravitational waves.
Returning to our CMB quilt metaphor, imagine many patterns on our quilt. All of them are hard to see because your quilt is so perfectly smooth and even. There are some patterns that are more prominent – the unevenness in temperature and E-modes in the polarization. There’s also other fabric on top of your quilt that’s not part of it at all – these are the foreground signals from the Milky Way. Lastly, you’re looking for one extremely subtle pattern – the B-modes from the primordial gravitational waves. Unfortunately, while your quilt was stretching out, some the E-mode patterns transformed in a way so now they look exactly like your B-modes.
All of these issues present a major challenge for scientists trying to find those tricky B-modes.
A collective effort
Fortunately, astrophysicists have options. Some telescopes can take data at multiple frequencies (colors), while others can take data at different resolutions.
Scientists are working to detect the degree angular scale primordial gravitational wave B-modes using cameras that are small and compact. To maximize their effectiveness, the four BICEP Array telescopes have lenses that are a half-meter in diameter and cameras that take data on five different frequencies.
“The BICEP telescopes are completely optimized to have the simplest and most constrained, cleanest systematics they possibly can,” said Bender. However, the array’s limited resolution limits how well it can detect and correct for the contaminating “lensed” B-modes.
In contrast, SPT’s extremely large mirrors give it incredible resolution. As a result, SPT can gather data on the E-modes that have transformed into B-modes. But that size also makes it difficult to get the ultra-clean systematics the BICEP array has at degree angular scales.
“It’s like a marriage,” said Bleem. “BICEP has the intense sensitivity at large scales and SPT can make these wonderful gravitational lensing maps, without which BICEP would be completely limited by the systematics. Together, they can achieve the targeted goals.”
Data from the Hershel and Planck space telescopes have also provided important data on galactic foregrounds and maps of the matter responsible for the lensing of the E-modes.
The various telescopes also allow researchers to check their results against one another.
“If there is a signal, you should be able to see that in both places,” said Wu. “These are excellent ways to really check whether a claim of detection is substantiated.”
Investigating the quilt for the B-mode pattern
Scientists took their first steps towards detecting the B-mode signal in 2013, the year that Planck released its first all-sky map of the CMB.
An initial detection
Around the same time, SPT’s then-new camera (SPTpol) made the first detection of any B-modes. (Parts of the SPT were built at Argonne.) With the use of a receiver built to measure the CMB’s polarization, scientists gathered data on both the E- and B-modes.
Physicists then used data from the Herschel space telescope to map out the large-scale structures in the universe that could have “bent” the E-modes on their way to Earth. This data allowed them to calculate the lensing potential – how much the E-modes changed over time. It’s like searching for what object a quilt got caught on to figure out how the pull could have affected the pattern. They used the National Energy Research Scientific Computing Center, a DOE Office of Science User Facility, to run the calculations.
“Being able to measure that signal for the first time … was very exciting,” recalled Carlstrom. Describing how the data jumped out at him, he said, “It was like ka-bam.”
This initial study showed that scientists would have the ability to separate out the B-modes from gravitational lensing from those from the primordial gravitational waves. The paper describes the technique as a “promising avenue.”
A brief deviation
While the first detection of B-modes was a major step forward, the next announcement faced some challenges.
In March 2014, the BICEP2 experiment team announced that they had detected B-modes from primordial gravitational waves. Based on three seasons of BICEP2 data, they published a non-peer reviewed preprint to the academic website arxiv. (This is a common practice for physics papers.)
The paper stated that the power spectrum they detected matched those from lensed B-modes – except for a bump that would indicate a gravitational wave signal from inflation.
But at an American Astronomical Society meeting that June, other researchers argued that the team hadn’t adequately accounted for the Milky Way’s dust. In response, researchers substantially edited the article before it was published in Physical Review Letters.
Data from the Planck team released a few months later – the most accurate measure of dust from the Milky Way yet – emphasized the importance of that revision. It showed the signal from the dust was in fact larger than assumed and could likely explain the signal that the BICEP team reported.
That message was further reinforced the next year, when the BICEP and Planck teams released a joint analysis that completely attributed the unusual signal to dust.
The situation demonstrated the importance of working and sharing data across collaborations. Having earlier access to the Planck data would have made a huge difference in the BICEP2 data interpretation.
“We have to try and talk to as much of the community as possible before putting out a result,” said Bender. “Maybe someone has the ultra-critical piece that sometimes you didn’t even know to ask about.”
All of the experiments became even more careful about addressing systematic issues. Almost immediately, the BICEP team expanded the program to take observations in more colors, which helps them better account for dust.
“We dialed up our skepticism on these things in the last ten years,” said Ahmed, who works on the BICEP Array. “If new data is coming in and it can be co-analyzed with ours, we would love that.”
Moving forward with delensing
The search to untangle the B-modes from the rest of the CMB quilt continued on.
The next step was for scientists to figure out how to “remove” the lensed B-modes from the rest of the data. Scientists call this process “delensing.”
Unfortunately, like everything else with B-modes, it’s not simple. Instead of just deleting certain patterns, scientists need to develop a template based on the gravitational lensing potential.
“It’s like making a map of all of the mass of the universe from when the universe was an infant to now,” said Wu, describing the lensing potential. Knowing that potential allows scientists to describe how gravitational lensing affected the E-modes.
To carry out this process, the SPT team – which included staff members from Argonne and Fermilab – combined data from the SPTpol camera and the Herschel Space Observatory.
Although they improved the delensing process, the team couldn’t reach the eventual goal – narrowing down the tensor-to-scalar ratio. This ratio describes the amplitude (distance from the middle) of primordial gravitational waves compared to the ripples in density. Different inflation theories provide different predictions. The simplest inflation models predict it will be between 0.05 and 0.1, while more complex ones predict a lower number. Nailing down that ratio would open the door to identifying the most accurate theory. Unfortunately, the data from SPTpol simply had too much “noise” to determine a ratio.
But further improvements were on their way.
2018 brought the best gravitational lensing maps of the CMB yet. It also brought an upper limit on the tensor-to-scalar ratio – less than 0.06. Another reconsideration of the BICEP2 data – with the addition of Planck and BICEP3 data – in 2021 brought an even smaller number. At 0.036, that ratio meant the space to find evidence of inflation was narrowing.
“It’s still the world’s tightest constraints on r. We are on the precipice,” said Ahmed. He and Wu were key members of the team that built the BICEP3 camera. “We haven’t found inflation, obviously. But we have eliminated many of the simple, clean models that people first wrote down.”
Meanwhile, the work on delensing continued.
A 2021 study combined data from SPTpol, the BICEP3 camera, Keck Array, and Planck to further reduce the uncertainty of the B-mode measurements. It was the first time they demonstrated that delensing could improve the constraints on the tensor-to-scalar ratio.
“It was the first time I produced an estimate of r,” said Wu. “I was like, ‘Oh, so cool!’”
In the past, the uncertainty from other sources was so high that it drowned out the uncertainty of the B-mode measurements. But now that better technology was bringing down those sources of uncertainty, delensing was becoming more and more important.
Everything was starting to come together.
Looking ahead to a more comprehensive view of the CMB
Most recently, scientists released two papers in preprints that bring us a little closer to that answer.
The first combines data from SPT-3G, the most recent version of the SPT camera, with Planck data. It describes how scientists have further improved the gravitational lensing templates that they will apply to the upcoming release of BICEP data. They estimate that the new template will result in a 30 percent reduction in how much the lensing contributes to the uncertainty around the tensor-to-sigma ratio.
“It’s just beautiful and the data in it, I’m very excited about that,” said Bender. She was on the team that designed and built the SPT-3G. In addition to researchers from Argonne, scientists from SLAC and Fermilab were also on the team. She described the process of seeing it go from an idea to an instrument: “There’s always hiccups along the way to getting the performance you want, even once you’ve built it and you’ve turned it on. … And then it works and it’s really fantastic once you start to see that performance roll out.”
The second paper uses the SPT-3G data to improve the lensing map of the CMB. It further improved the precision of the measurements and reduced the noise.
As the SPT-3G and BICEP Array take data, scientists will continue to pick apart those various patterns on the map of the CMB. They’re also looking forward to installing the BICEP Array+ and SPT-3G+ - an even more ambitious combination of tools.
“It will have almost 10 times faster mapping speed than the current camera on the telescope,” said Benson, referring to the SPT-3G+. “If you compare it to the original camera that we put on the SPT 20 years ago, it’s at least 100 times faster mapping speed.”
When combined with the BICEP data gathered through 2024, scientists will be able to create much more comprehensive maps of the CMB. By sorting through those maps to trace the primordial gravitational wave B-modes, they’ll provide new insights into the cosmic quilt from research at the bottom of the world.
“It is really rewarding to see the SPT. When I started working on it, it was just a proposal – we hadn’t built the telescope yet,” said Benson. “The fact that we can still do cutting-edge science with it and sustaining it over 20 years has been really satisfying.”