
SUBSCRIBE to the Fact of the Week
U.S. field production of petroleum was over 12.5 million barrels per day (mmbd) for the first time in 2015, and declined to 12.3 mmbd in 2016. Before this, U.S. production reached a high of 11.3 mmbd in 1970. There had been a general trend of declining petroleum production from 1985 to 2008, but from 2008 to 2015 production increased each year, amounting to an overall 88% increase in that seven-year time frame. As noted in Fact #964, transportation fuels (gasoline, diesel, and jet fuel) make up three-quarters of the refined petroleum production in the United States.
U.S. Petroleum Production, 1949-2016
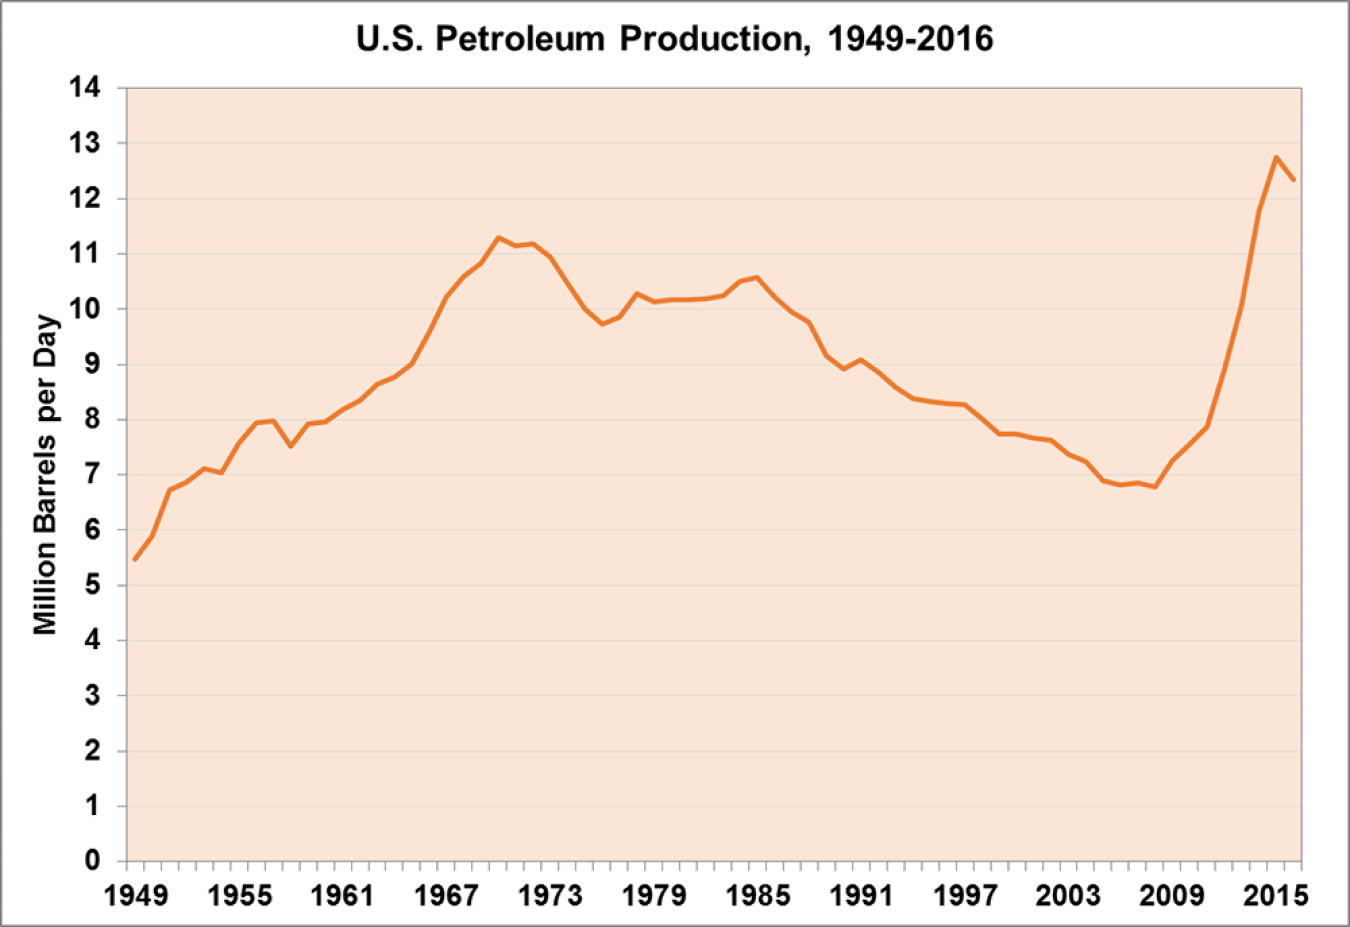
Note: Field production of petroleum includes crude oil production on leases, and natural gas liquids (liquefied petroleum gases, pentanes plus, and a small amount of finished petroleum products) production at natural gas processing plants.
Supporting Information
| Year | Total Petroleum Field Production (Million Barrels per Day) |
|---|---|
| 1949 | 5.48 |
| 1950 | 5.91 |
| 1951 | 6.72 |
| 1952 | 6.87 |
| 1953 | 7.11 |
| 1954 | 7.03 |
| 1955 | 7.58 |
| 1956 | 7.95 |
| 1957 | 7.98 |
| 1958 | 7.52 |
| 1959 | 7.93 |
| 1960 | 7.96 |
| 1961 | 8.17 |
| 1962 | 8.35 |
| 1963 | 8.64 |
| 1964 | 8.77 |
| 1965 | 9.01 |
| 1966 | 9.58 |
| 1967 | 10.22 |
| 1968 | 10.60 |
| 1969 | 10.83 |
| 1970 | 11.30 |
| 1971 | 11.16 |
| 1972 | 11.18 |
| 1973 | 10.95 |
| 1974 | 10.46 |
| 1975 | 10.01 |
| 1976 | 9.74 |
| 1977 | 9.86 |
| 1978 | 10.27 |
| 1979 | 10.14 |
| 1980 | 10.17 |
| 1981 | 10.18 |
| 1982 | 10.20 |
| 1983 | 10.25 |
| 1984 | 10.51 |
| 1985 | 10.58 |
| 1986 | 10.23 |
| 1987 | 9.94 |
| 1988 | 9.76 |
| 1989 | 9.16 |
| 1990 | 8.91 |
| 1991 | 9.08 |
| 1992 | 8.87 |
| 1993 | 8.58 |
| 1994 | 8.39 |
| 1995 | 8.32 |
| 1996 | 8.29 |
| 1997 | 8.27 |
| 1998 | 8.01 |
| 1999 | 7.73 |
| 2000 | 7.73 |
| 2001 | 7.67 |
| 2002 | 7.62 |
| 2003 | 7.37 |
| 2004 | 7.25 |
| 2005 | 6.90 |
| 2006 | 6.82 |
| 2007 | 6.86 |
| 2008 | 6.78 |
| 2009 | 7.26 |
| 2010 | 7.55 |
| 2011 | 7.86 |
| 2012 | 8.89 |
| 2013 | 10.07 |
| 2014 | 11.78 |
| 2015 | 12.76 |
| 2016 | 12.35 |
Source: Energy Information Administration, January 2017 Monthly Energy Review, Table 3.1. | |