
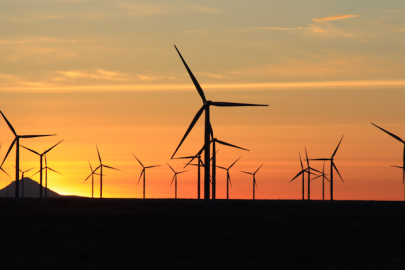
U.S. wind power has more than tripled in the past decade to become the largest source of renewable generating capacity in the country. Three market reports released by the U.S. Department of Energy detail 2018 trends in wind technology, cost, and performance.
These reports present a unique combination of publicly available, confidential, and proprietary data. They provide unbiased, independent, public reporting of the current state of the industry and provide insight into multiyear trends.
Wind Technologies Market Report
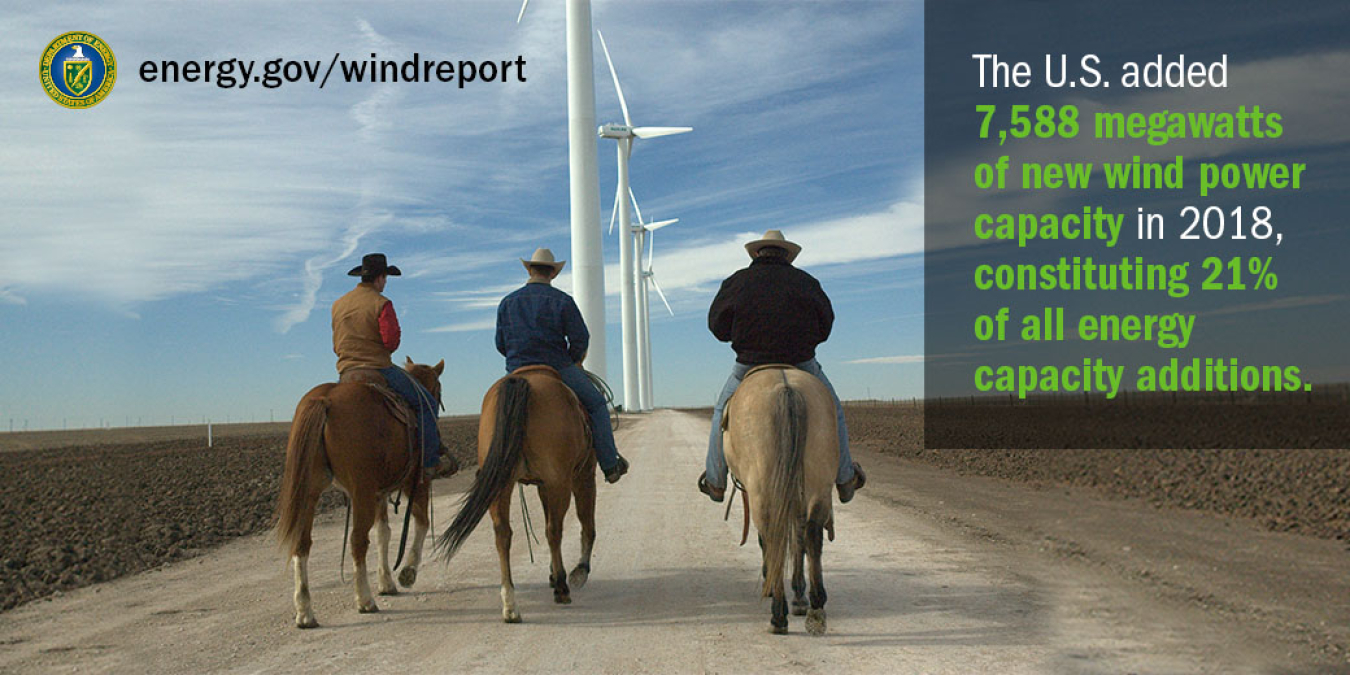
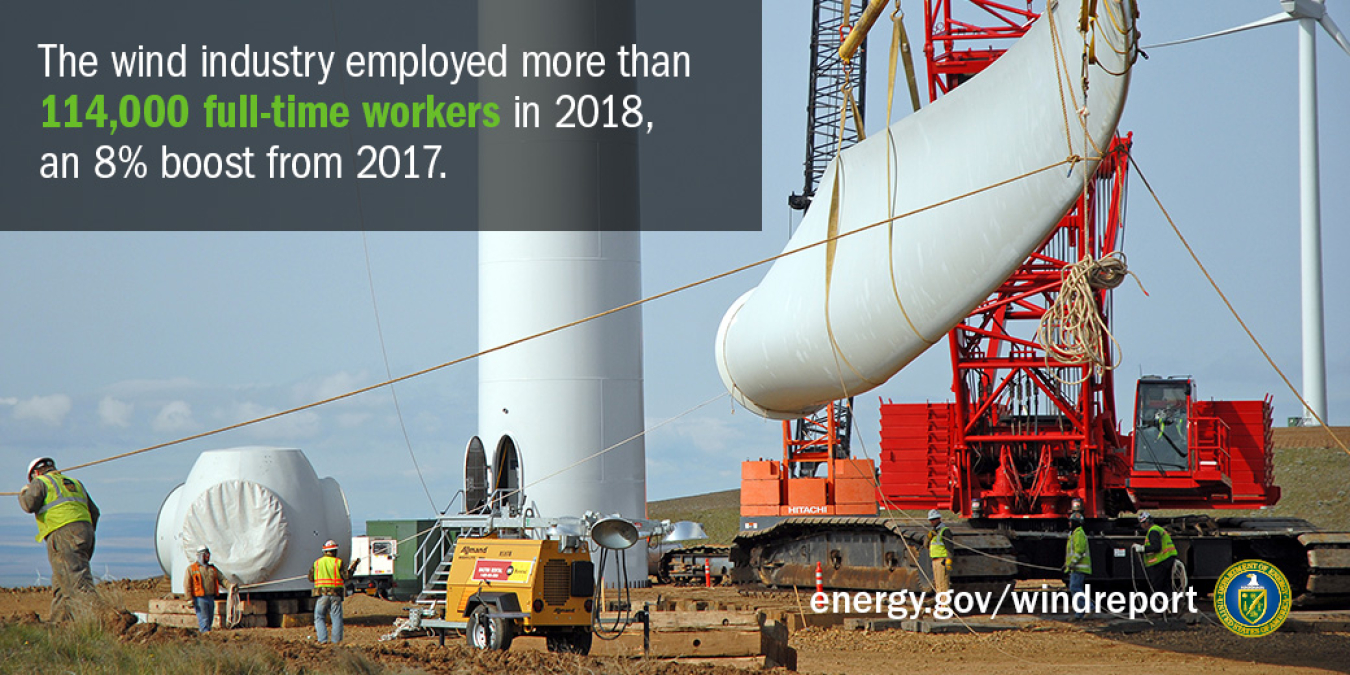
U.S. wind power additions continued at a strong pace in 2018, with 7,588 megawatts (MW) of new capacity added and $11 billion funded. Wind power represented the third-largest source of U.S. electric-generating capacity additions in 2018, behind solar and natural gas.
Improvements in the cost and performance of wind power technologies have also driven wind capacity additions, yielding low-priced wind energy for utility, corporate, and other power purchasers. Continuing the long-term trend, average turbine capacity, rotor diameter, and hub height increased in 2018, significantly boosting wind project performance.
Download the 2018 Wind Technologies Market Report
Learn more about this year's most notable trends in the land-based wind market.
Get the details on a few of the lesser known wind energy facts.
Distributed Wind Market Report
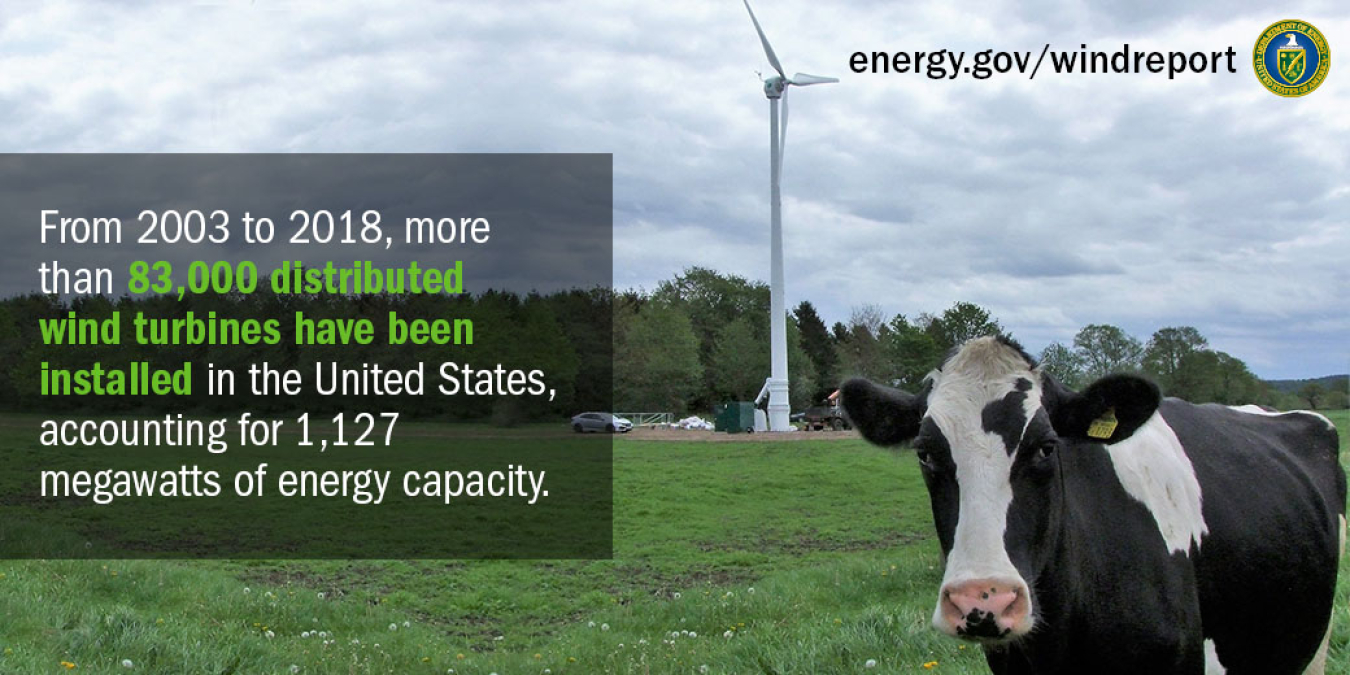
Cumulative U.S. distributed wind capacity installed from 2003 to 2018 reached 1,127 MW from more than 83,000 wind turbines across all 50 states, Puerto Rico, the U.S. Virgin Islands, and Guam.
In 2018, 12 states added 50.5 MW of new distributed wind capacity, representing 2,684 units and $226 million in funding. Of this new capacity, 21 MW was installed in Rhode Island by a single developer for multiple customers—illustrating a trend in which a few project developers using large-scale turbines work almost exclusively in specific states rather than nationwide, resulting in annual distributed wind capacity additions concentrated in a few states.
Download the 2018 Distributed Wind Market Report or the Distributed Wind Market Report Fact Sheet
Check out our Distributed Wind Photo Gallery for case studies and more information on distributed wind.
There are many different types of distributed wind customer. Find out more about distributed wind and who uses it.
Learn about key facts related to wind turbines used in distributed applications.
Offshore Wind Technologies Market Report
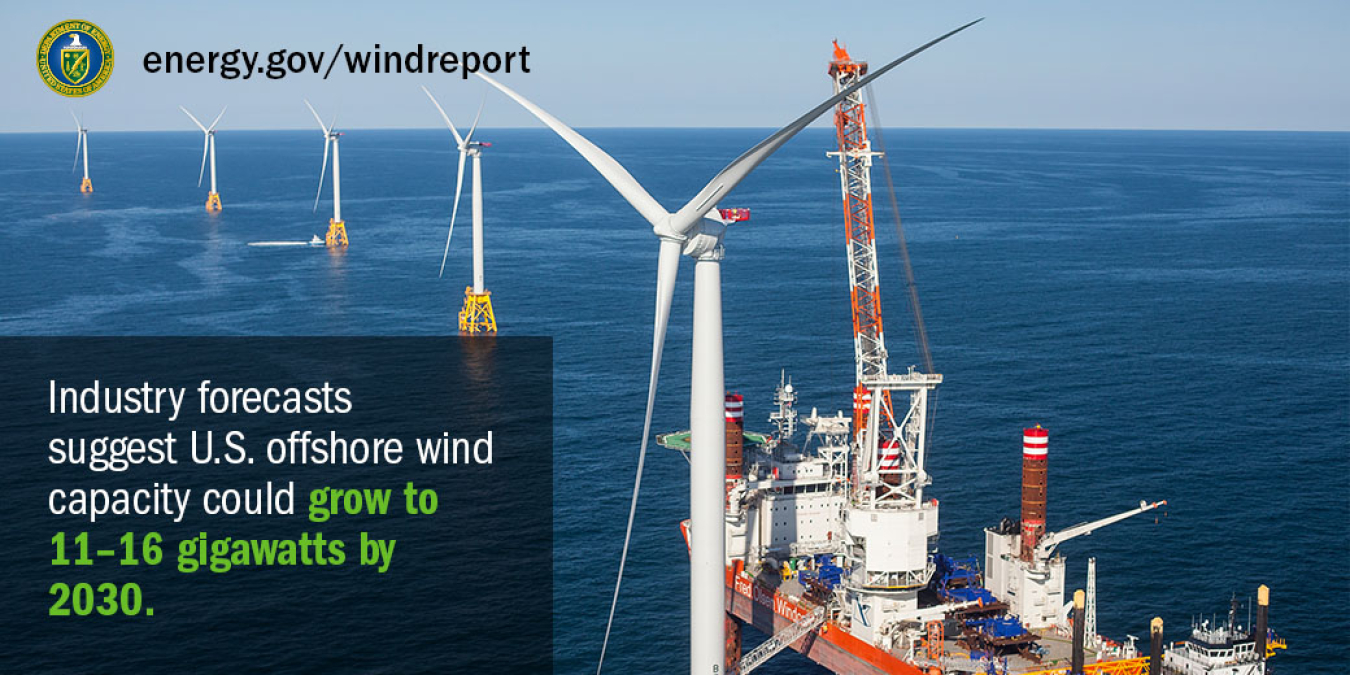
Driven by falling offshore wind turbine prices in the United States, accelerated federal offshore wind lease auctions, and state procurement mechanisms, the U.S. offshore wind energy project development and operational pipeline grew in 2018 to an estimated potential generating capacity of 25,824 MW.
While development and regulatory activities have historically been concentrated in the North Atlantic region from Virginia northward, new offshore wind activities have been initiated in the Pacific, Great Lakes, and South Atlantic regions as well.
Download the 2018 Offshore Wind Technologies Market Report
Trends leading the offshore wind market into a decade of unprecedented growth.
Learn more about efforts to develop America's vast offshore wind resources.
Learn More
-
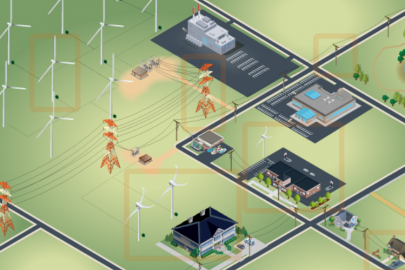 Distributed wind systems are connected on the customer side of the meter to meet the onsite load or directly to distribution or microgrids.
How much do you know about wind energy? Test your knowledge with our wind power quiz!
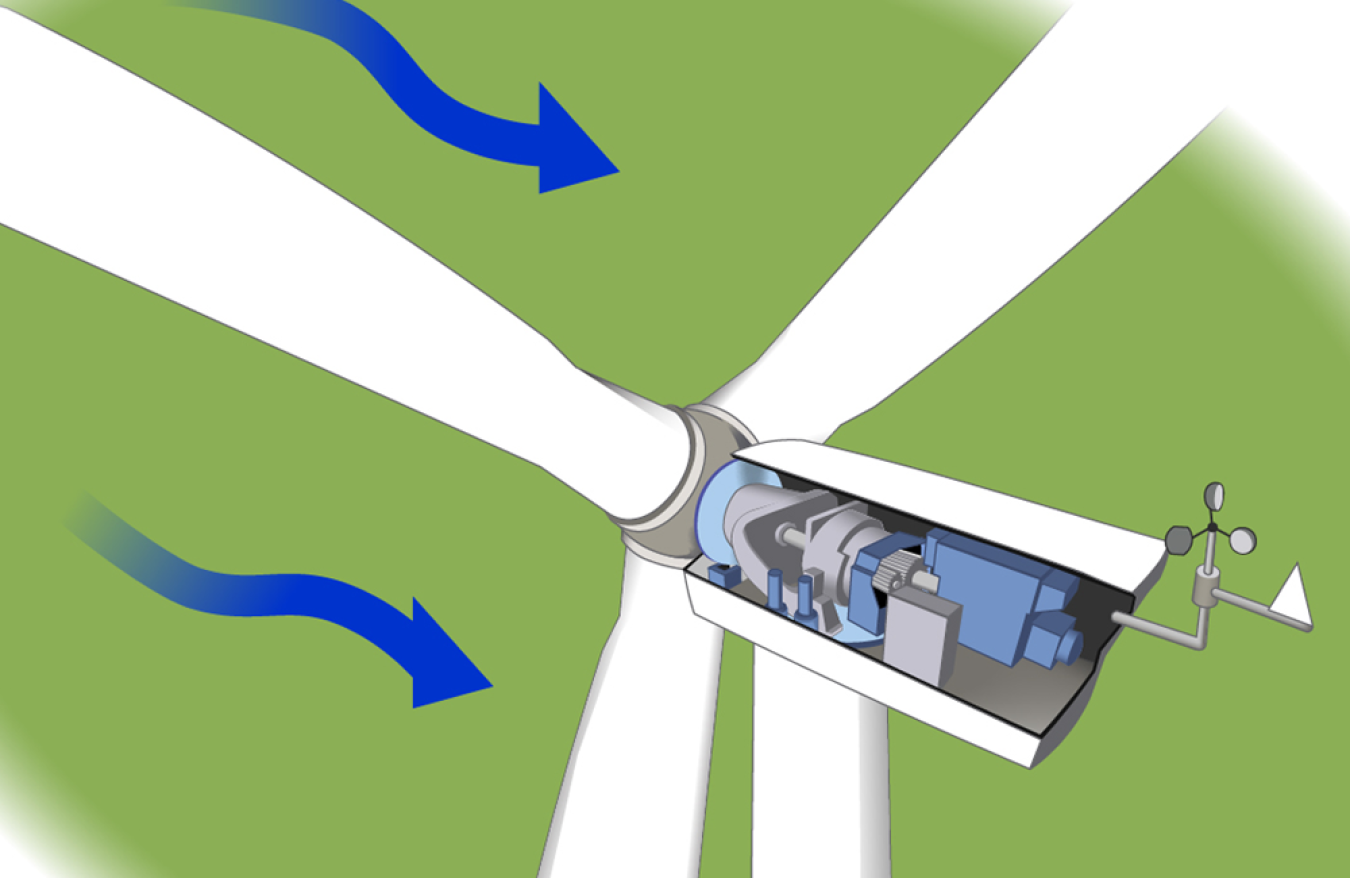
Learn how wind turbines operate to produce clean power from an abundant, renewable resource—the wind.