
Top trends leading the offshore wind market into a decade of unprecedented growth.
Integrated Energy Systems Office
August 30, 2021The U.S. offshore wind market is expected to see massive growth in the next decade. The U.S. Department of Energy’s Offshore Wind Market Report: 2021 Edition estimates a potential generating capacity of 35,324 megawatts (MW) in the project development pipeline at the end of May 2021. Below are the top trends that are leading the offshore wind market into a decade of unprecedented growth.
1. Decreasing Offshore Auction Prices
The figure below shows the declining trend in the price of offshore wind sold in auctions globally. The winning auction prices were adjusted for contract length, grid connection, and revenue mechanism for an “all-in” comparison. The placement of Vineyard Wind (the first approved commercial-scale project in the United States) within that trend shows early movers in the rising U.S. offshore market may be able to capitalize on cost reductions seen elsewhere in the world. It emphasizes that the United States can remain competitive within the global market and that barriers such as a limited domestic supply chain, which had been a concern, may not hinder the future of the U.S. market.
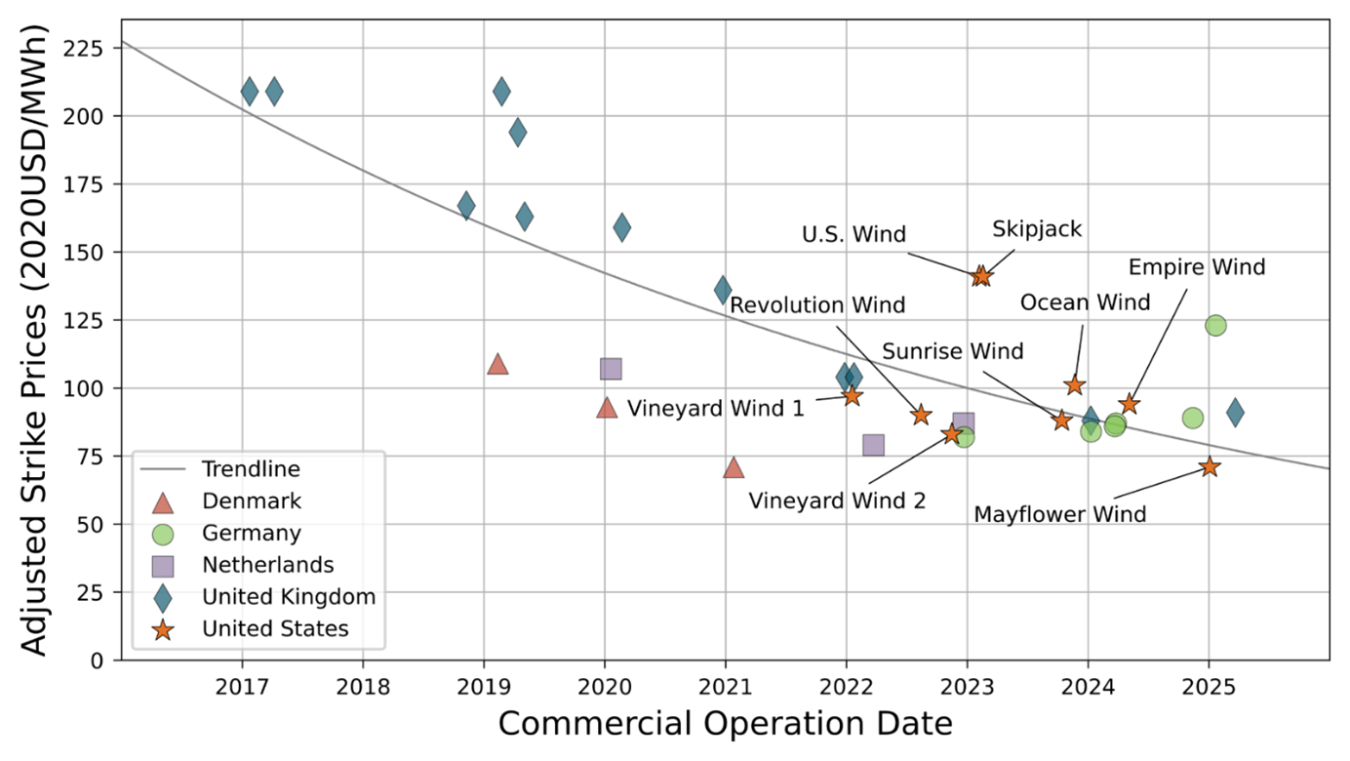
Adjusted strike prices in dollars per megawatt-hour of planned electricity sales for projects in European and U.S. offshore wind auctions. | Figure 38 from the Offshore Wind Market Report: 2021 Edition.
2. Increasing Water Depths of Projects
When siting an offshore wind project, the water depth of the site is an important factor as the turbine’s foundation must be specifically engineered for that depth. Projects on the West Coast of the United States will be deployed in deeper water due to the narrow continental shelf and steeply declining continental slope. East Coast projects may also wish to deploy farther offshore in order to reduce competition with other uses of the ocean while also limiting the visibility of the offshore turbines from shore. An increase in global project depth, as shown in the figure below, is a positive indicator for the market. This increase is due to improved engineering of turbines, installation cost reductions, and the development of turbines with floating substructures. This trend suggests that technological advancements can allow for economically competitive installation of offshore wind turbines in deeper waters.
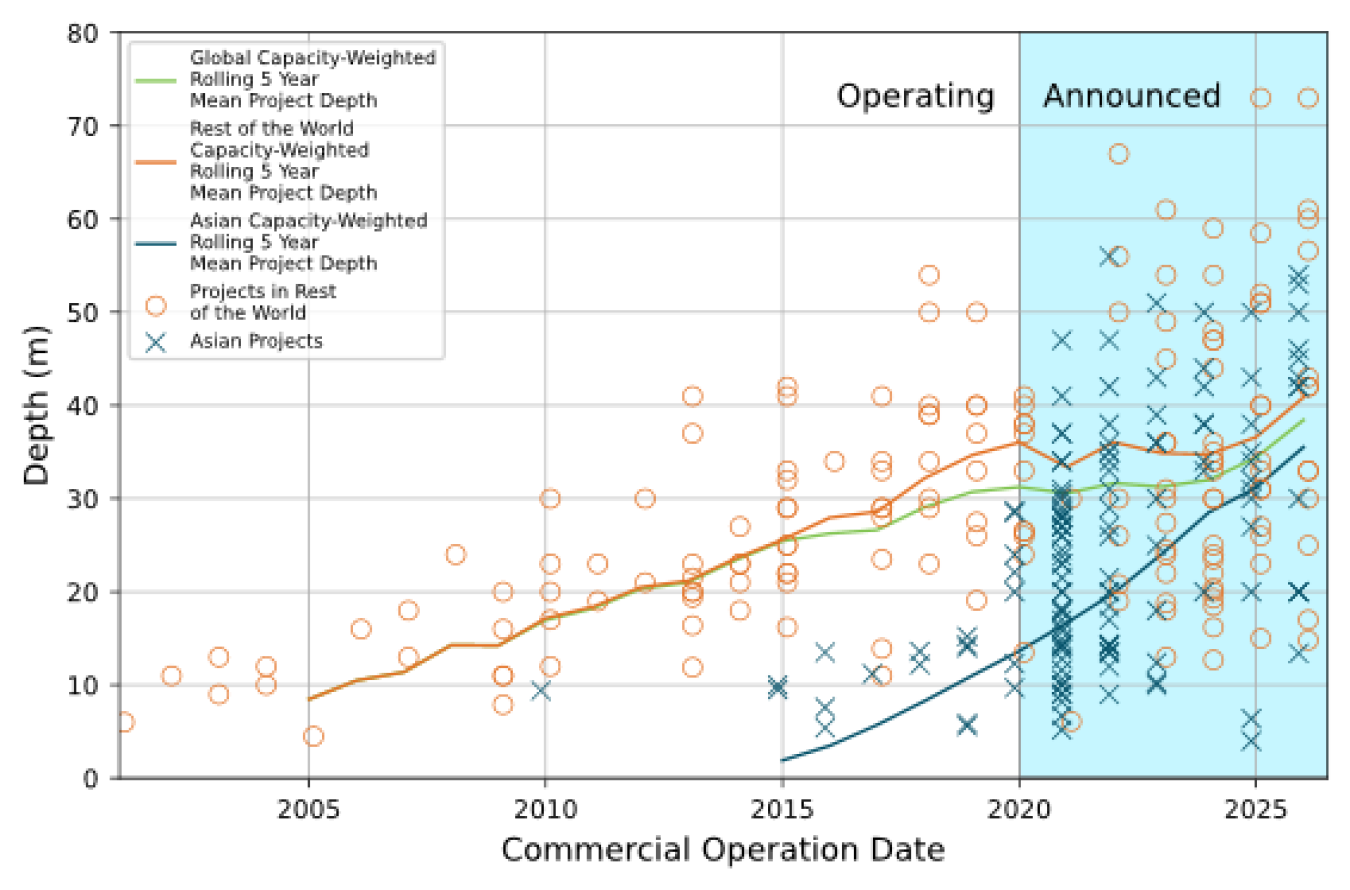
Global offshore wind project water depth trend to 2026. | Figure 23 from the Offshore Wind Market Report: 2021 Edition.
3. Increasing Turbine Capacity
The capacity of a wind turbine is often referred to as its rated power, or how much power it can produce when operating at full capability. The dark blue bars in the figure below show a steady increase in the capacity of offshore wind turbines worldwide. The symbols illustrate the capacities of the largest prototypes, which are expected to become commercially available several years later. The upward trend shows the continued development of larger turbines that require fewer turbines to produce the same amount of power compared to their smaller predecessors. This continued growth in rated power is one of the many factors that has led to lower offshore wind costs.
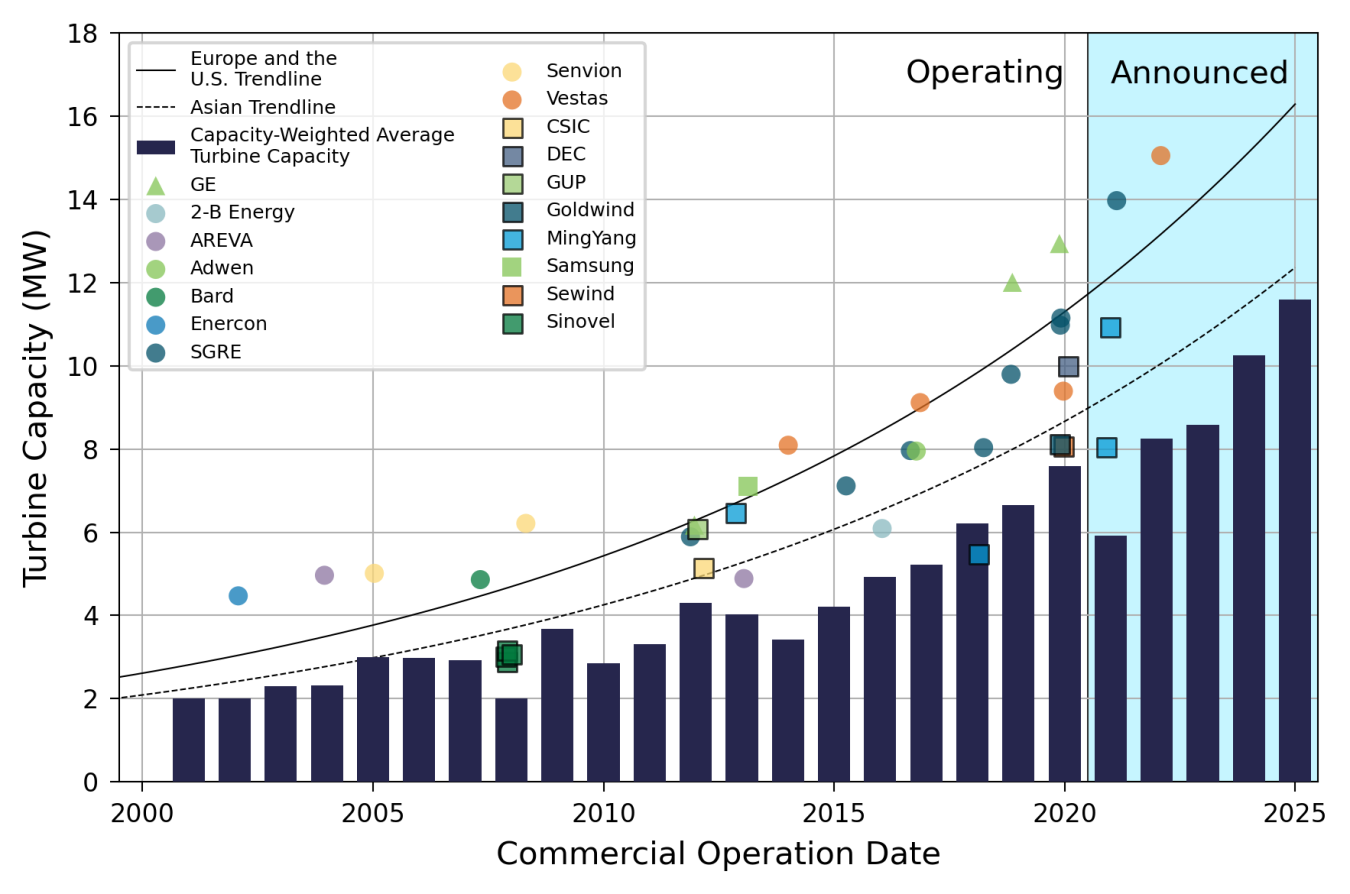
Turbine capacity trends (in MW) through 2025. | Figure 28 from the Offshore Wind Market Report: 2021 Edition.
4. Decreasing Global Levelized Cost of Energy
The levelized cost of energy, or LCOE, is a metric that allows different technologies of unequal lifespans, sizes, and initial capital costs to be compared. The trend line in the below figure highlights a decreasing levelized cost of energy from offshore wind worldwide. The reductions in the levelized cost of offshore wind energy have been aided by technology improvements in energy capture, reduced capital expenditures, the advent of larger turbines, competition in international markets, and reduced international lending rates, among many other factors.
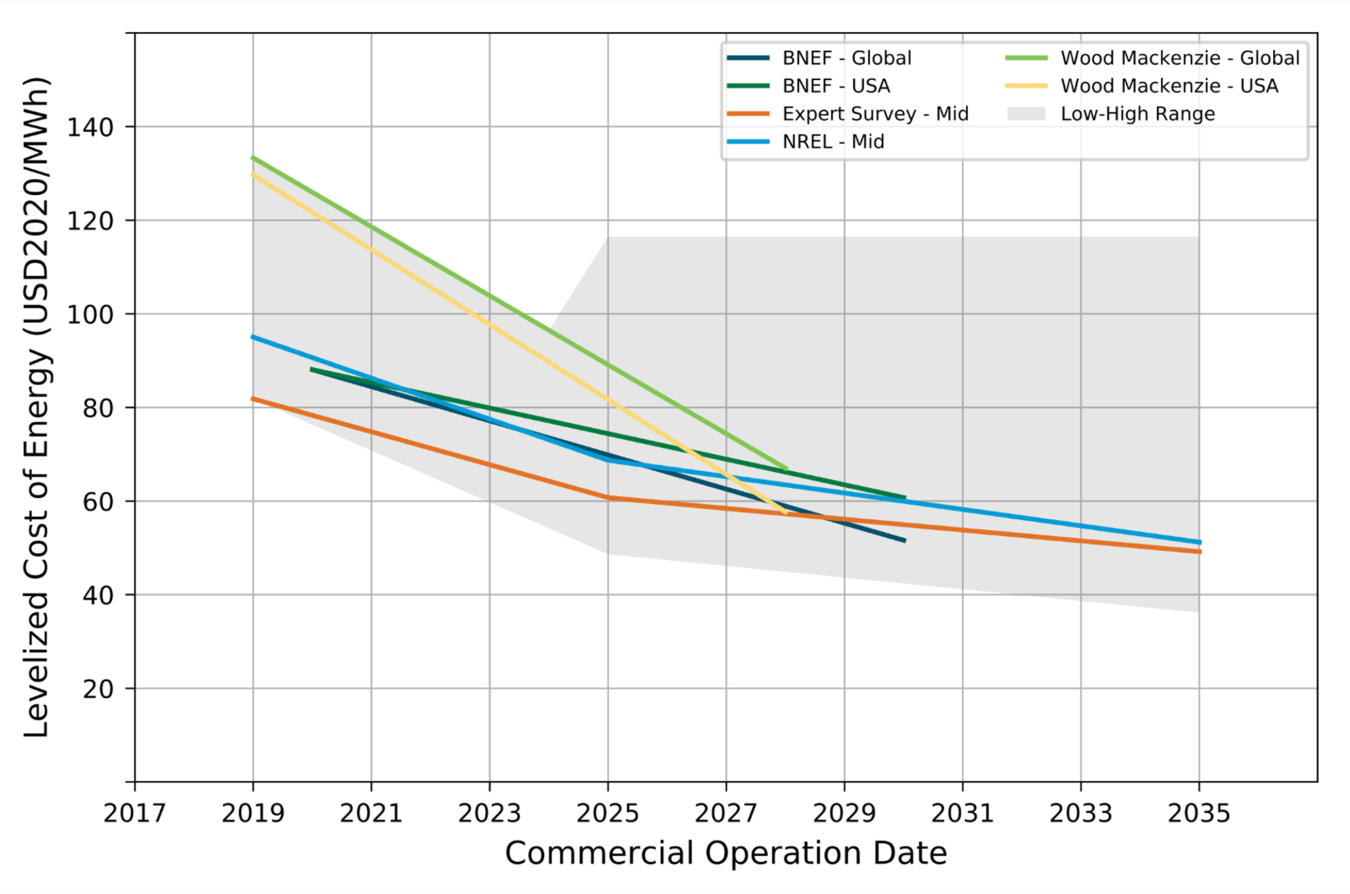
Global levelized cost of energy estimates for fixed-bottom offshore wind. | Figure 35 from the Offshore Wind Market Report: 2021 Edition.
Learn more about the U.S. offshore wind market in the U.S. Department of Energy’s Offshore Wind Market Report: 2021 Edition.