
SUBSCRIBE to the Fact of the Week
Despite a 120% increase in horsepower and 47% improvement in acceleration (measured by time to accelerate from 0 to 60 mph) from model year (MY) 1980 to 2016, the fuel economy of vehicles improved 33%. The data are based on sales-weighted averages. In the 1990s and early 2000s, fuel economy decreased while vehicle weight increased, and fuel economy has improved nearly every year since 2004.
Characteristics of New Light Vehicles Sold, MY 1980-2016
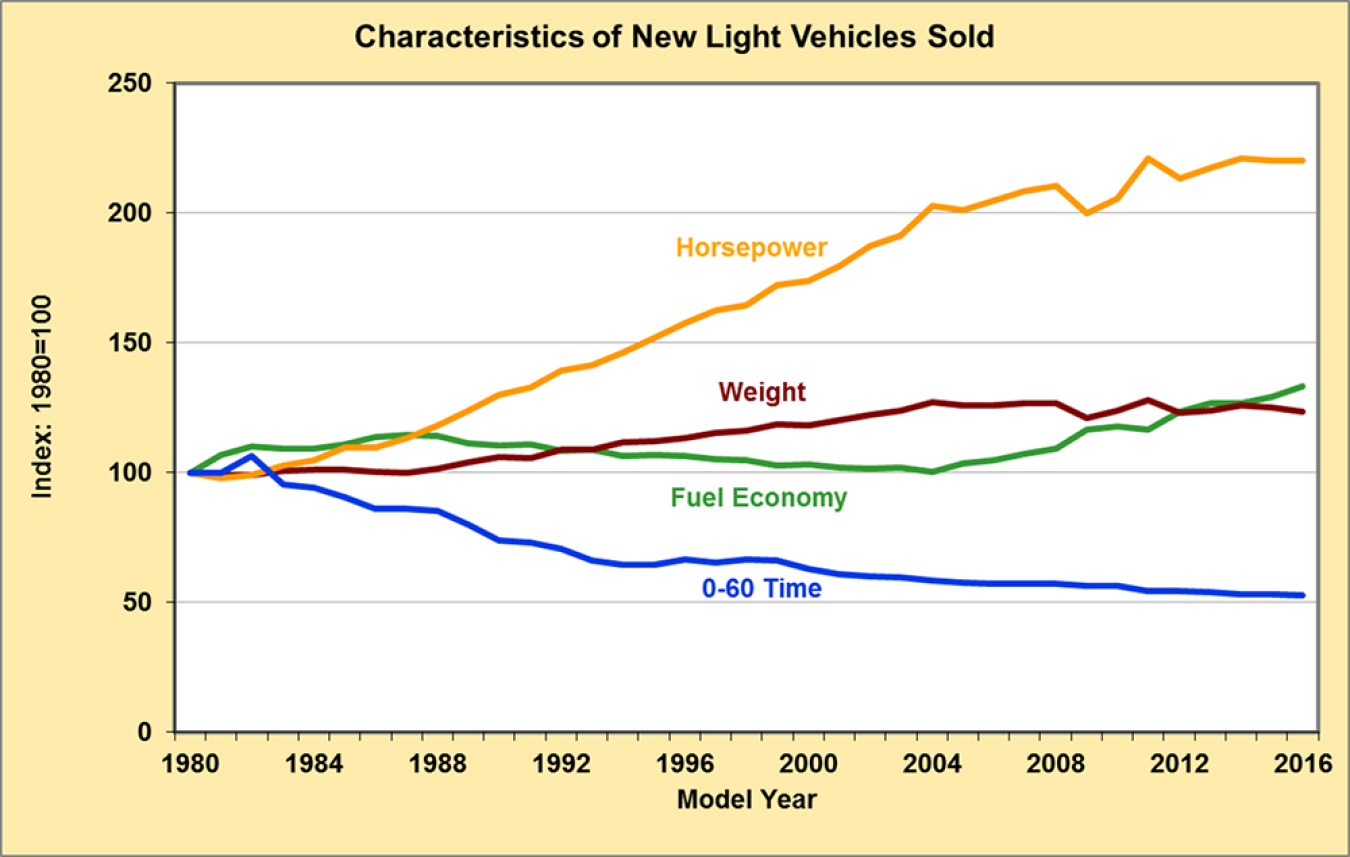
Note: Data are sales-weighted.
Supporting Information
| Model Year | Original Values | Indexed Values (Graph) | |||||||
|---|---|---|---|---|---|---|---|---|---|
| Fuel Economy | Weight | Horse-power | 0-60 Time | Fuel Economy | Weight | Horse-power | 0-60 Time | ||
| Miles per Gallon | Pounds | Seconds | Miles per Gallon | Pounds | Seconds | ||||
| 1980 | 19.2 | 3,228 | 104 | 15.6 | 100 | 100 | 100 | 100 | |
| 1981 | 20.5 | 3,202 | 102 | 15.6 | 107 | 99 | 98 | 100 | |
| 1982 | 21.1 | 3,202 | 103 | 16.6 | 110 | 99 | 99 | 106 | |
| 1983 | 21.0 | 3,257 | 107 | 14.9 | 109 | 101 | 103 | 96 | |
| 1984 | 21.0 | 3,262 | 109 | 14.7 | 109 | 101 | 105 | 94 | |
| 1985 | 21.3 | 3,271 | 114 | 14.1 | 111 | 101 | 110 | 90 | |
| 1986 | 21.8 | 3,238 | 114 | 13.4 | 114 | 100 | 110 | 86 | |
| 1987 | 22.0 | 3,221 | 118 | 13.4 | 115 | 100 | 113 | 86 | |
| 1988 | 21.9 | 3,283 | 123 | 13.3 | 114 | 102 | 118 | 85 | |
| 1989 | 21.4 | 3,351 | 129 | 12.5 | 111 | 104 | 124 | 80 | |
| 1990 | 21.2 | 3,426 | 135 | 11.5 | 110 | 106 | 130 | 74 | |
| 1991 | 21.3 | 3,410 | 138 | 11.4 | 111 | 106 | 133 | 73 | |
| 1992 | 20.8 | 3,512 | 145 | 11.0 | 108 | 109 | 139 | 71 | |
| 1993 | 20.9 | 3,519 | 147 | 10.3 | 109 | 109 | 141 | 66 | |
| 1994 | 20.4 | 3,603 | 152 | 10.1 | 106 | 112 | 146 | 65 | |
| 1995 | 20.5 | 3,613 | 158 | 10.1 | 107 | 112 | 152 | 65 | |
| 1996 | 20.4 | 3,659 | 164 | 10.4 | 106 | 113 | 158 | 67 | |
| 1997 | 20.2 | 3,727 | 169 | 10.2 | 105 | 115 | 163 | 65 | |
| 1998 | 20.1 | 3,744 | 171 | 10.4 | 105 | 116 | 164 | 67 | |
| 1999 | 19.7 | 3,835 | 179 | 10.3 | 103 | 119 | 172 | 66 | |
| 2000 | 19.8 | 3,821 | 181 | 9.8 | 103 | 118 | 174 | 63 | |
| 2001 | 19.6 | 3,879 | 187 | 9.5 | 102 | 120 | 180 | 61 | |
| 2002 | 19.5 | 3,951 | 195 | 9.4 | 102 | 122 | 188 | 60 | |
| 2003 | 19.6 | 3,999 | 199 | 9.3 | 102 | 124 | 191 | 60 | |
| 2004 | 19.3 | 4,111 | 211 | 9.1 | 101 | 127 | 203 | 58 | |
| 2005 | 19.9 | 4,059 | 209 | 9.0 | 104 | 126 | 201 | 58 | |
| 2006 | 20.1 | 4,067 | 213 | 8.9 | 105 | 126 | 205 | 57 | |
| 2007 | 20.6 | 4,093 | 217 | 8.9 | 107 | 127 | 209 | 57 | |
| 2008 | 21.0 | 4,085 | 219 | 8.9 | 109 | 127 | 211 | 57 | |
| 2009 | 22.4 | 3,914 | 208 | 8.8 | 117 | 121 | 200 | 56 | |
| 2010 | 22.6 | 4,001 | 214 | 8.8 | 118 | 124 | 206 | 56 | |
| 2011 | 22.4 | 4,126 | 230 | 8.5 | 117 | 128 | 221 | 54 | |
| 2012 | 23.7 | 3,979 | 222 | 8.5 | 123 | 123 | 213 | 54 | |
| 2013 | 24.3 | 4,003 | 226 | 8.4 | 127 | 124 | 217 | 54 | |
| 2014 | 24.3 | 4,060 | 230 | 8.3 | 127 | 126 | 221 | 53 | |
| 2015 | 24.8 | 4,035 | 229 | 8.3 | 129 | 125 | 220 | 53 | |
| 2016 | 25.6 | 3,985 | 229 | 8.2 | 133 | 123 | 220 | 53 | |
Source: U.S. Environmental Protection Agency, Light-Duty Automotive Technology, Carbon Dioxide Emissions, and Fuel Economy Trends: 1975 through 2016, EPA-420-R-16-010, November 2016. | |||||||||