
SUBSCRIBE to the Fact of the Week
Monthly plug-in vehicle (PEV) sales are small in comparison to total vehicle sales, but PEV sales shares are growing within some size classes. Looking at six-month moving totals, subcompact PEV sales were 4% of all subcompact sales from September 2014 to February 2015 and after an early-year decline rose to 3.7% by late 2015 despite falling gasoline prices. Large PEV sales were 1.4% of all large car sales in early 2014, but rose to 2.5% by the July to December 2015 period. The compact car and standard SUV categories posted overall gains during this timeframe. Midsize PEV sales, which include the Nissan Leaf, fell from a high of 2.6% of all midsize sales in mid-2014 to 1.5% by December 2015.
Share of PEV Sales to All Sales in Size Class, and Gasoline Prices,
June 2014 - December 2015
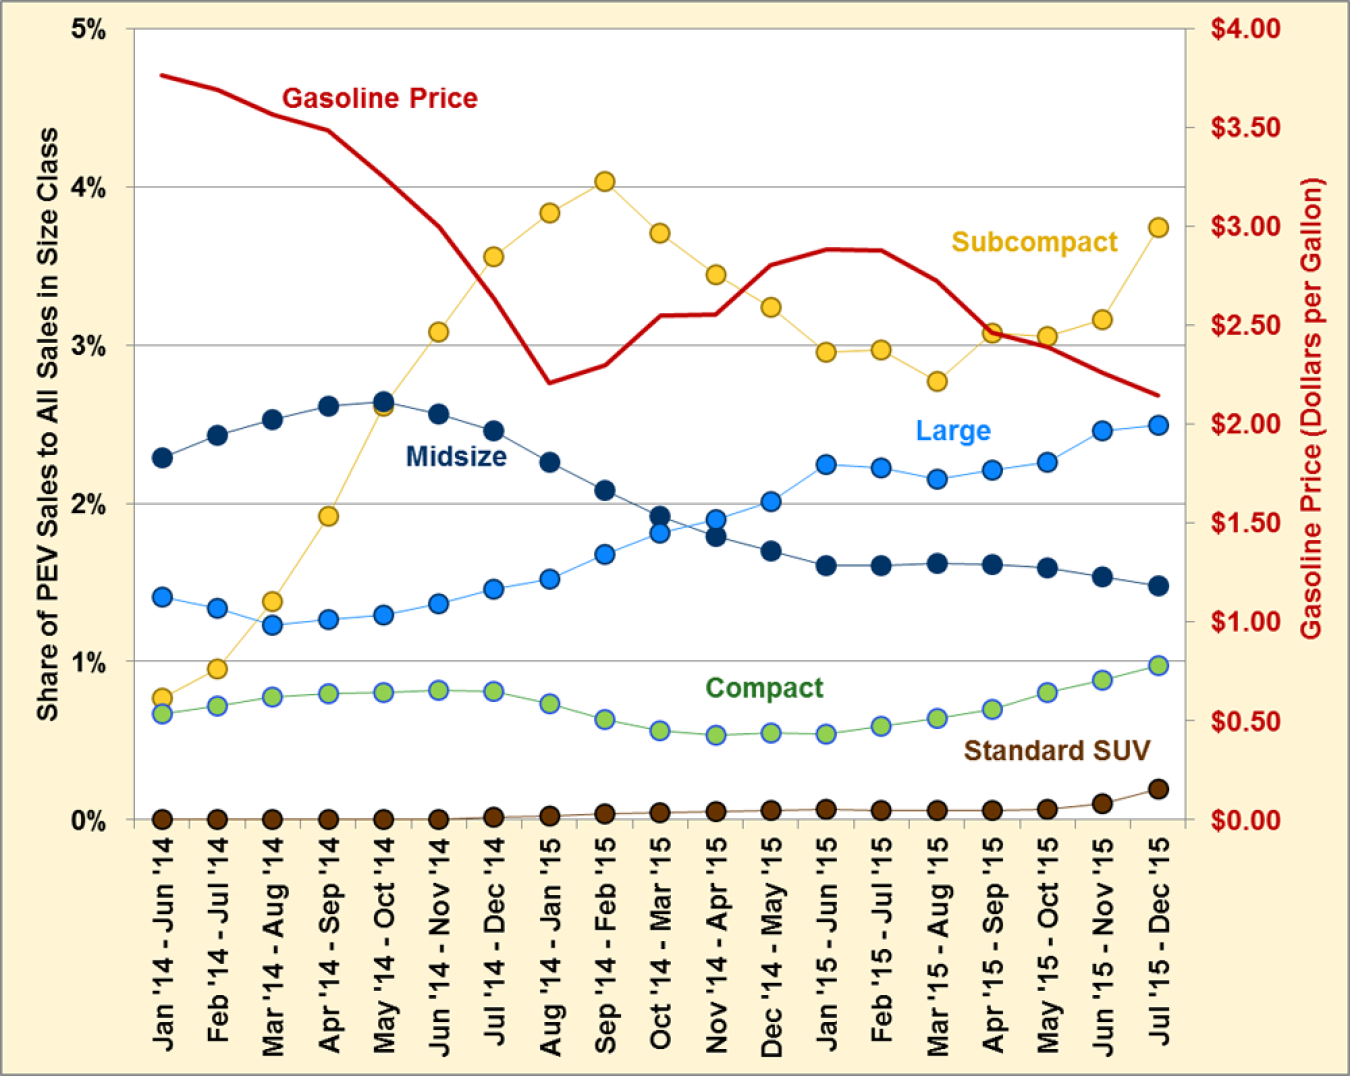
Note: The "Shares of PEV Sales to All Sales in Size Class" are six-month moving totals, which helps to adjust for seasonal variation and provide data smoothing.
| Vehicle Size Class | Make/Model |
|---|---|
| Subcompact | Mitsubishi iMiEV BMW Active E Chevrolet Spark Cadillac ELR BMW i3 BMW i8 |
| Compact | Chevrolet Volt Ford Focus VW e-Golf Audi A3 Plug In |
| Midsize | Nissan Leaf Prius PHEV Ford C-Max Energi Honda Accord Ford Fusion Energi Mercedes B-Class Hyundai Sonata Plug In |
| Large | Tesla Model S Porsche Panamera S E-Hybrid Mercedes S550 Plug |
| Standard SUV | Porsche Cayenne S E-hybrid Volvo-XC90 Plug In Tesla Model X BMW X5 |
Supporting Information
| Month-Year | Share of PEV Sales to All Sales in Size Class | Regular Gasoline Price (Dollars per Gallon) | ||||
|---|---|---|---|---|---|---|
| Subcompact | Compact | Midsize | Large | Standard SUV (4WD) | ||
| Jan '14 - Jun '14 | 0.77% | 0.67% | 2.29% | 1.41% | 0.00% | $3.77 |
| Feb '14 - Jul '14 | 0.95% | 0.72% | 2.43% | 1.34% | 0.00% | $3.69 |
| Mar '14 - Aug '14 | 1.38% | 0.78% | 2.53% | 1.23% | 0.00% | $3.57 |
| Apr '14 - Sep '14 | 1.92% | 0.80% | 2.61% | 1.27% | 0.00% | $3.48 |
| May '14 - Oct '14 | 2.61% | 0.80% | 2.64% | 1.30% | 0.00% | $3.26 |
| Jun '14 - Nov '14 | 3.08% | 0.82% | 2.57% | 1.36% | 0.01% | $3.00 |
| Jul '14 - Dec '14 | 3.56% | 0.81% | 2.46% | 1.46% | 0.01% | $2.63 |
| Aug '14 - Jan '15 | 3.83% | 0.73% | 2.26% | 1.52% | 0.02% | $2.21 |
| Sep '14 - Feb '15 | 4.03% | 0.63% | 2.08% | 1.68% | 0.04% | $2.30 |
| Oct '14 - Mar '15 | 3.71% | 0.56% | 1.92% | 1.81% | 0.04% | $2.55 |
| Nov '14 - Apr '15 | 3.44% | 0.53% | 1.79% | 1.90% | 0.05% | $2.56 |
| Dec '14 - May '15 | 3.24% | 0.55% | 1.70% | 2.01% | 0.06% | $2.80 |
| Jan '15 - Jun '15 | 2.95% | 0.54% | 1.61% | 2.25% | 0.06% | $2.89 |
| Feb '15 - Jul '15 | 2.97% | 0.59% | 1.61% | 2.22% | 0.06% | $2.88 |
| Mar '15 - Aug '15 | 2.77% | 0.64% | 1.62% | 2.15% | 0.06% | $2.73 |
| Apr '15 - Sep '15 | 3.07% | 0.70% | 1.61% | 2.21% | 0.06% | $2.46 |
| May '15 - Oct '15 | 3.06% | 0.81% | 1.59% | 2.26% | 0.06% | $2.39 |
| Jun '15 - Nov '15 | 3.16% | 0.88% | 1.54% | 2.46% | 0.10% | $2.26 |
| Jul '15 - Dec '15 | 3.74% | 0.97% | 1.48% | 2.49% | 0.19% | $2.14 |
| Sources: PEV data provided by Yan Zhou, Argonne National Laboratory, Light Duty Electric Drive Vehicles Monthly Sales Updates, May 2016. Sales by size class data provided by Russ Campbell, SRA International, May 2016. | ||||||