
SUBSCRIBE to the Fact of the Week
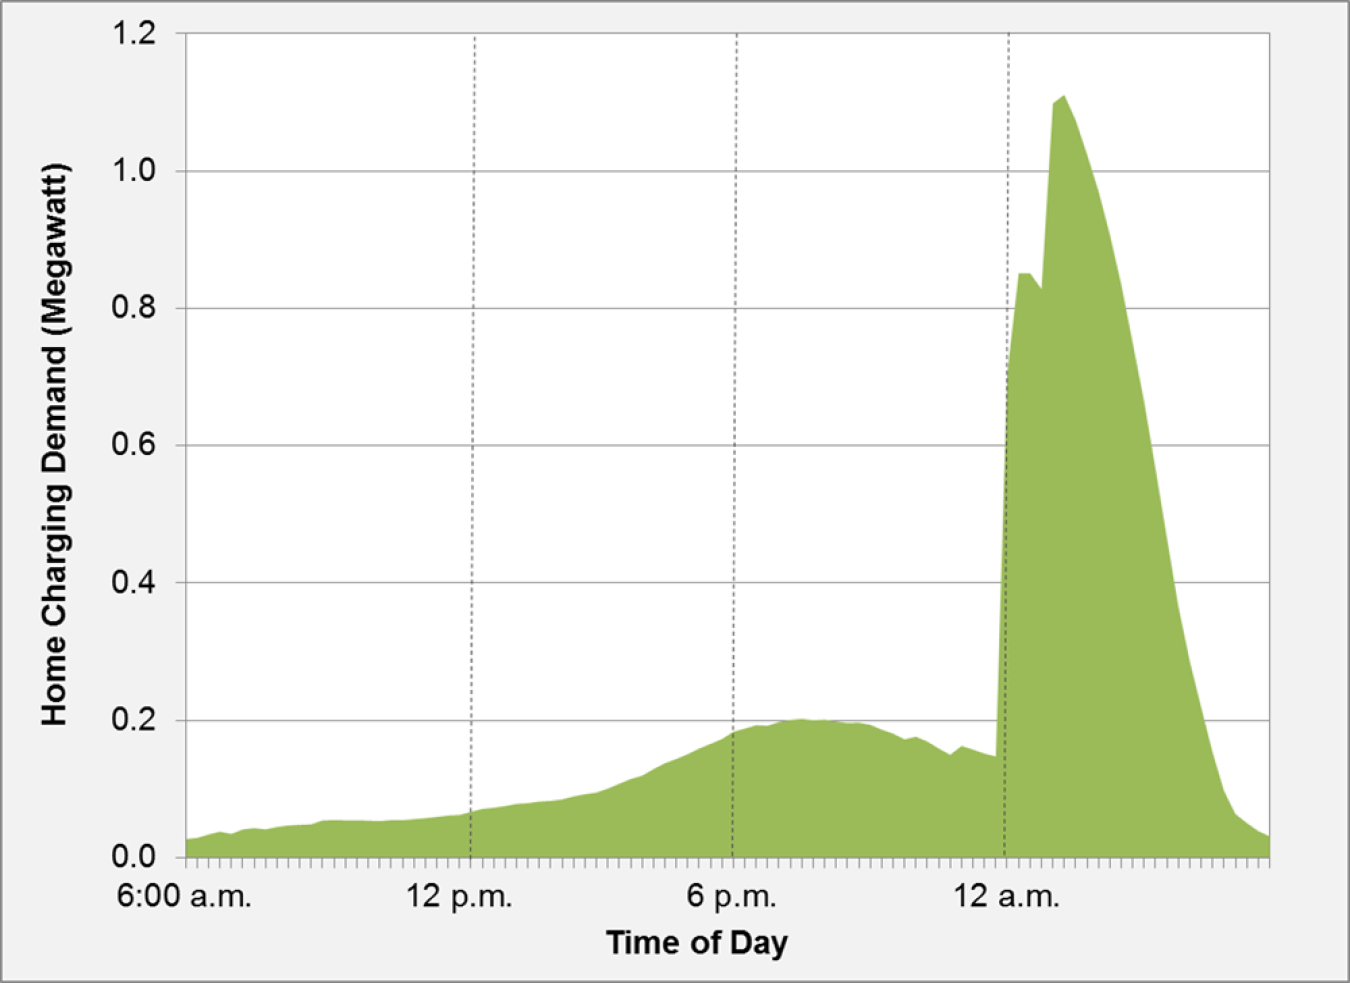
In the San Diego area, electricity rates are lowest between midnight and 5:00 am. Plug-in vehicles and charging equipment can be scheduled to begin charging when rates are lowest. Analysis of the EV Project data from the San Diego area showed a pronounced spike in charging after midnight, demonstrating the willingness of plug-in vehicle owners to schedule a delay for charging when there is a benefit. An example of typical weekday charging shows the peak for home charging demand of all study vehicles in the area was over one megawatt at 1:30 a.m.
Example of Typical Weekday Charging Demand for All EV Project Vehicles in the San Diego Area
Supporting Information
| Time of day | Total Home Charging Demand (Megawatts) |
|---|---|
| 6:00 a.m. | 0.03 |
| 6:15 | 0.03 |
| 6:30 | 0.03 |
| 6:45 | 0.04 |
| 7:00 a.m. | 0.03 |
| 7:15 | 0.04 |
| 7:30 | 0.04 |
| 7:45 | 0.04 |
| 8:00 a.m. | 0.04 |
| 8:15 | 0.05 |
| 8:30 | 0.05 |
| 8:45 | 0.05 |
| 9:00 a.m. | 0.05 |
| 9:15 | 0.05 |
| 9:30 | 0.05 |
| 9:45 | 0.05 |
| 10:00 a.m. | 0.05 |
| 10:15 | 0.05 |
| 10:30 | 0.05 |
| 10:45 | 0.05 |
| 11:00 a.m. | 0.06 |
| 11:15 | 0.06 |
| 11:30 | 0.06 |
| 11:45 | 0.06 |
| 12:00 p.m. | 0.06 |
| 12:15 | 0.07 |
| 12:30 | 0.07 |
| 12:45 | 0.07 |
| 1:00 p.m. | 0.08 |
| 1:15 | 0.08 |
| 1:30 | 0.08 |
| 1:45 | 0.08 |
| 2:00 p.m. | 0.08 |
| 2:15 | 0.08 |
| 2:30 | 0.09 |
| 2:45 | 0.09 |
| 3:00 p.m. | 0.09 |
| 3:15 | 0.10 |
| 3:30 | 0.11 |
| 3:45 | 0.11 |
| 4:00 p.m. | 0.12 |
| 4:15 | 0.13 |
| 4:30 | 0.14 |
| 4:45 | 0.14 |
| 5:00 p.m. | 0.15 |
| 5:15 | 0.16 |
| 5:30 | 0.17 |
| 5:45 | 0.17 |
| 6:00 p.m. | 0.18 |
| 6:15 | 0.19 |
| 6:30 | 0.19 |
| 6:45 | 0.19 |
| 7:00 p.m. | 0.20 |
| 7:15 | 0.20 |
| 7:30 | 0.20 |
| 7:45 | 0.20 |
| 8:00 p.m. | 0.20 |
| 8:15 | 0.20 |
| 8:30 | 0.20 |
| 8:45 | 0.20 |
| 9:00 p.m. | 0.19 |
| 9:15 | 0.19 |
| 9:30 | 0.18 |
| 9:45 | 0.17 |
| 10:00 p.m. | 0.18 |
| 10:15 | 0.17 |
| 10:30 | 0.16 |
| 10:45 | 0.15 |
| 11:00 p.m. | 0.16 |
| 11:15 | 0.16 |
| 11:30 | 0.15 |
| 11:45 | 0.15 |
| 12:00 a.m. | 0.70 |
| 12:15 | 0.85 |
| 12:30 | 0.85 |
| 12:45 | 0.83 |
| 1:00 a.m. | 1.10 |
| 1:15 | 1.11 |
| 1:30 | 1.07 |
| 1:45 | 1.02 |
| 2:00 a.m. | 0.97 |
| 2:15 | 0.91 |
| 2:30 | 0.83 |
| 2:45 | 0.75 |
| 3:00 a.m. | 0.66 |
| 3:15 | 0.57 |
| 3:30 | 0.47 |
| 3:45 | 0.37 |
| 4:00 a.m. | 0.29 |
| 4:15 | 0.22 |
| 4:30 | 0.15 |
| 4:45 | 0.10 |
| 5:00 a.m. | 0.06 |
| 5:15 | 0.05 |
| 5:30 | 0.04 |
| 5:45 | 0.03 |
Source: "Plugged In: How Americans Charge Their Electric Vehicles," Idaho National Laboratory, Report INL/EXT-15-35584, 2015, Page 17. | |