




Overview
Each year, the U.S. Department of Energy (DOE) Integrated Energy Systems Office (IESO) and its national laboratory partners analyze cost data for U.S. solar photovoltaic (PV) systems to develop cost benchmarks. These benchmarks help measure progress toward reducing solar electricity costs and guide solar research and development programs. Read more to find out how these cost benchmarks are modeled and download the data and cost modeling program below.
Purpose and Scope
Market analysts routinely monitor and report the average cost of PV systems and components, but more detail is needed to understand how technology developments will affect these costs. Consequently, IESO evaluates benchmark systems in the utility-scale, commercial, and residential PV market sectors each year. Each benchmark system is representative of what is currently being installed in the United States and is defined in sufficient detail to assess the impact of system size, module efficiency, overhead, and many other factors on cost.
Unlike most PV cost studies that report values solely in dollars per watt, IESO reports values using intrinsic units for each component. For example, the cost of a mounting structure is given in dollars per square meter of modules supported by that structure. This measure is independent of how much power is produced by those modules, making it possible to assess the benefit of improving PV module efficiency. This approach is intended to allow any input parameter in the model to be varied by up to a factor of two (higher or lower) to assess its impact on cost.
All costs reported are represented in two ways: minimum sustainable price (MSP) and modeled market price (MMP). MSP is the minimum price (with inflation adjustment) that a company can charge for its product or service in a balanced, competitive market and remain financially solvent for the long term, assuming that each of the company’s input costs also represent the MSP for that cost element. MMP is the actual price in the current market, which may differ from MSP as a result of temporary market distortions. MSP is the more useful metric for long-term planning, including R&D direction and predicting the future of the power grid. MMP is the more useful metric for short-term planning, including the impact of tax and trade policies.
Data Collection
Three DOE national laboratories—Lawrence Berkeley National Laboratory, National Laboratory of the Rockies, and Sandia National Laboratories—collect cost data from PV industry stakeholders. Each stakeholder is contacted by only one lab to avoid overlap. The industry survey seeks to understand the cost structure for each stakeholder, including how their costs are affected by scale, overhead, and market distortions. Data collection focuses on transactions in the first quarter of the calendar year.
Each lab’s data is analyzed by that lab and submitted to IESO along with a weighting factor that represents the equivalent number of independent data sources utilized for each cost element.
In addition to the cost of installing each benchmark system, the cost for operation and maintenance (O&M) is analyzed. The total O&M cost over the service life of the system is amortized to give a levelized cost per year.
PV System Cost Model
In the PV System Cost Model (PVSCM), the PV system owner’s overnight capital expense (cash cost) for the installed PV system is divided into eight categories, which are the same for the utility-scale, commercial, and residential PV market segments:
- Module – The cost to the installer of photovoltaic modules, as delivered.
- Inverter – The cost to the installer of equipment for converting direct current (dc) to alternating current (ac), as delivered.
- Energy Storage System (ESS) – The cost to the installer of adding an energy storage system, as delivered.
- Structural Balance of System (SBOS) – The cost to the installer of structural balance of system components, as delivered.
- Electrical Balance of System (EBOS) – The cost to the installer of electrical balance of system components, as delivered.
- Fieldwork – The cost to the installer of work performed at the installation site.
- Office work – The cost to the installer of work performed off-site.
- Other – Costs and overhead incurred by the project developer not included elsewhere.
The first five categories are referred to as the hardware cost and the last three categories are referred to as the soft cost.
Each of the eight cost categories is divided into a maximum of 14 cost elements. Each cost element is the sum of a fixed cost (independent of size) plus a variable cost that is proportional to size. The meaning of “size” depends on the category. It’s the annual production rate of the manufacturing facility for Module, Inverter, and ESS; the rated capacity of the installed system for SBOS, EBOS, Fieldwork, and Office work; and the rated capacity of the developer’s annual system installations for Other. The variable cost is given in dollars per intrinsic unit, with the intrinsic unit chosen that most directly scales with size for that item.
The PVSCM system cost is the price paid by the system owner to the project developer. Any tax credit realized by the owner is excluded from this model and must be considered separately. Tariffs paid on imported hardware are treated as temporary market distortions that increase MMP but not MSP. Subsidies for domestically produced hardware are also treated as temporary market distortions, which decrease MMP but not MSP.
Working with PVSCM Data
PVSCM is implemented using an Excel spreadsheet. It collects the cost elements for each category, then sums the categories to obtain the system cost, for both MSP and MMP. Market distortions are explicitly noted in the spreadsheet’s Comments column. Unit conversion multipliers are listed on a separate sheet labeled Factors. An additional sheet is used to calculate the annualized cost of the installed system’s O&M.
Utility-Scale PV System (UPV)
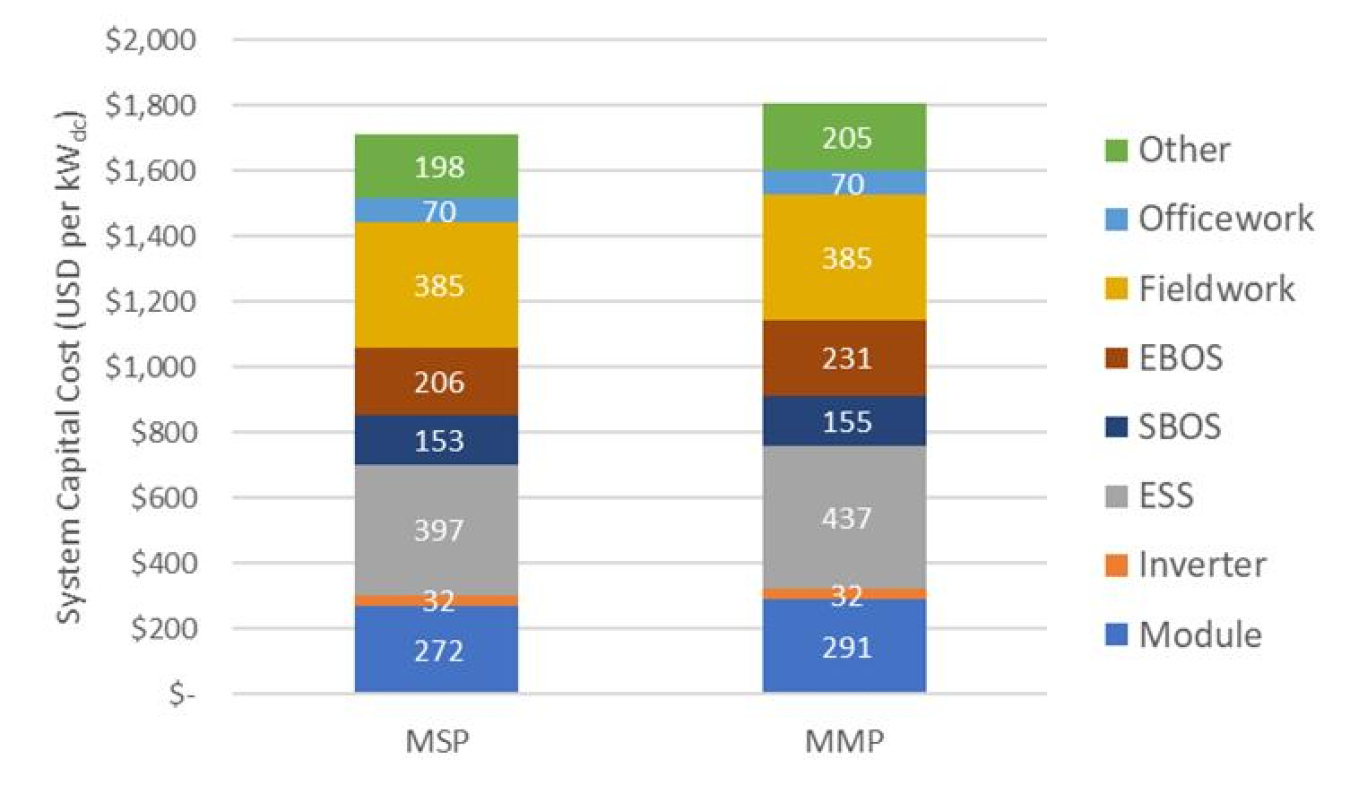
Figure 1 presents the UPV benchmark system cost components by cost category for both MSP and MMP for a system combining 100 MWdc of PV modules with 240 MWh of ESS. The cost values represent weighted-average figures based on the data collected by all three participating national laboratories. Details, including O&M, can be found in UPV 2025Q1.txt in the PVSCM ZIP file.
Representative UPV System Description
The representative utility-scale PV system for 2025 has a rating of 100 MWdc (the sum of the system’s module ratings). Each module has a rated power of 600 watts, corresponding to an efficiency of 21.9%. The bifacial modules were manufactured in the United States in a plant producing 1.5 GWdc per year, using crystalline silicon solar cells produced in Southeast Asia. The module producer received a 45X tax credit of $70/kWdc in 2025 currency. During the first quarter of 2025, the cells were subject to AD/CVD duties, but not the Section 201 import tariff.
About 167,000 of these modules are mounted on single-axis tracking structures that are assembled in the field and occupy a land area of 155 hectares. Most of the tracker components were produced domestically.
The dc cables are connected to 19 utility-scale central inverters, each rated at 4 MWac, giving the PV system a rated ac power output of 76 MWac, which corresponds to an inverter loading ratio of 1.34. The inverters are made in Europe in a plant that produces 250 of them each year. During the first quarter of 2025, these inverters were not subject to import tariffs.
The ESS is comprised of 60 pad-mounted lithium-ion battery cabinets, each with an energy storage capacity of 4 MWh for a total of 240 MWh of storage. Each ESS cabinet includes a bidirectional inverter rated at 1 MWac (4-hour discharge duration) for a total of 60 MWac. The ESS inverter is ac coupled with the PV inverter. The ESS system is assembled in the United States using components imported from China and subject to 25% import tariff. The ESS producer receives a 45X tax credit of $10/kWh in 2025 currency for battery modules.
O&M for the UPV system includes module cleaning, periodic inspection, repairs, replacement of components, lease on the land, property tax, insurance, and management. Because component replacements occur well into the future, the price of those replacements is based on the MSP of those components, rather than MMP.
Commercial PV System (CPV)
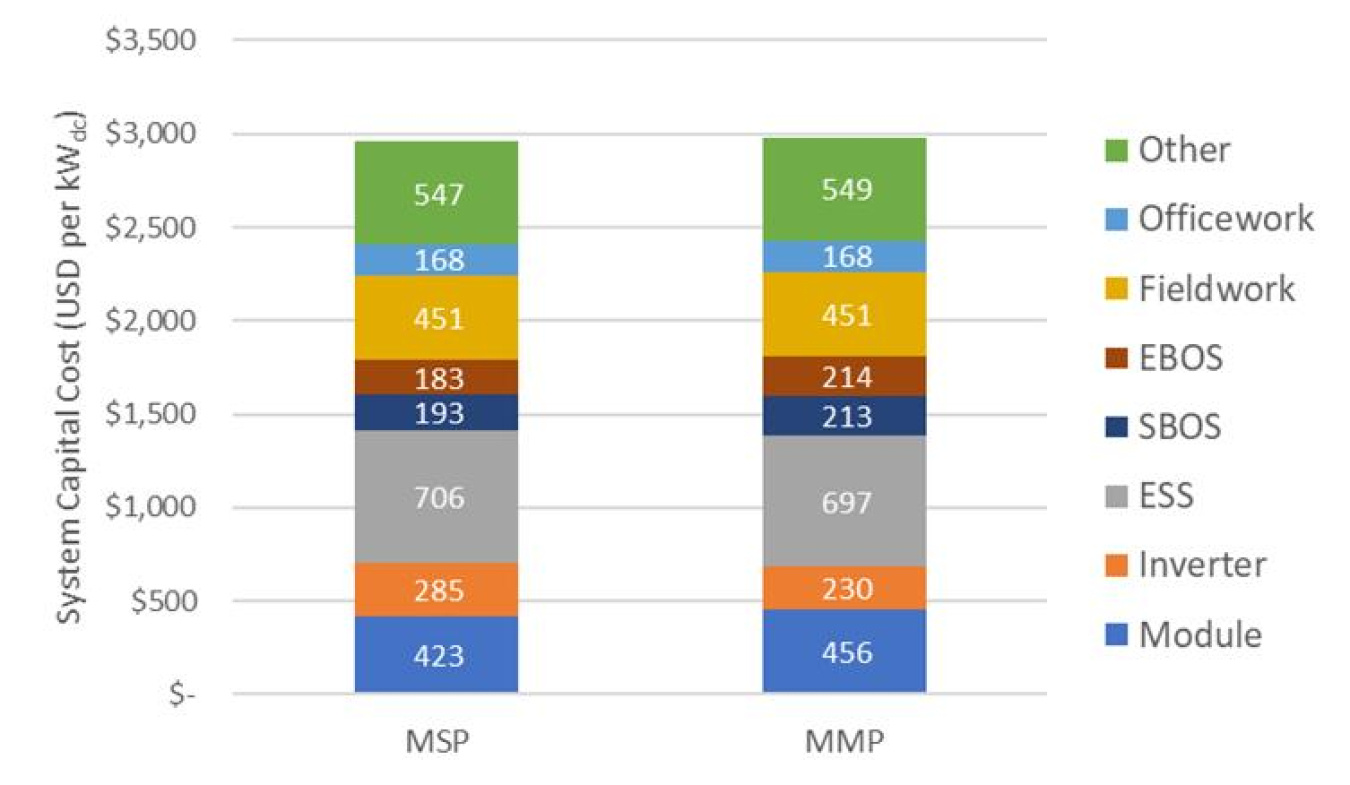
Figure 2 presents the CPV benchmark system cost components by cost category for both MSP and MMP for a system combining 250 kWdc of PV modules with 500 kWh of ESS. The cost values represent weighted-average figures based on the data collected by all three participating national laboratories. Details, including O&M, can be found in CPV 2025Q1.txt in the PVSCM ZIP file.
Representative CPV System Description
The representative commercial PV system for 2025 is a school rooftop system that meets Build America, Buy America (BABA) requirements for domestic content. The system has a power rating of 250 kWdc (the sum of the system’s module ratings). Each module has a rated power of 500 watts, corresponding to an efficiency of 21.1%. The bifacial modules were produced in the United States in a plant producing 1.5 GWdc per year, using crystalline silicon solar cells also produced in the United States. The module producer received a 45X tax credit of $70/kWdc and the cell producer received a 45X tax credit of $40/kWdc in 2025 currency.
About 500 of these modules are mounted on a south-facing fixed-tilt structure located on the flat roof of the school. The module rails and clamps were imported from China and subject to 25% import tariff.
Each module is equipped with a 600 Wdc dc optimizer. The dc conductors are then connected to 8 three-phase string inverters, each rated at 25 kWac, giving the PV system a rated ac power output of 200 kWac, which corresponds to an inverter loading ratio of 1.20. The dc optimizers and inverters are made in the United States in a plant that produces 2 GWac of them each year. The inverter producer received a 45X tax credit of $110/kWac in 2025 currency for the dc optimizers in combination with the string inverters.
The ESS is comprised of two pad-mounted lithium-ion battery cabinets, each with an energy storage capacity of 250 kWh for a total of 500 kWh of storage. The ESS cabinet includes a bidirectional inverter rated at 62.5 kWac (4-hour discharge duration) for a total of 125 kWac. The ESS inverter is ac coupled with the PV inverter. The ESS system is assembled in the United States using domestic components. The ESS producer received a 45X tax credit of $45/kWh in 2025 currency for battery cells and modules.
O&M for the CPV system includes module cleaning, periodic inspection, repairs, replacement of components, insurance, and management. Because component replacements occur well into the future, the price of those replacements is based on the MSP of those components, rather than MMP.
Residential Rooftop PV System (RPV)
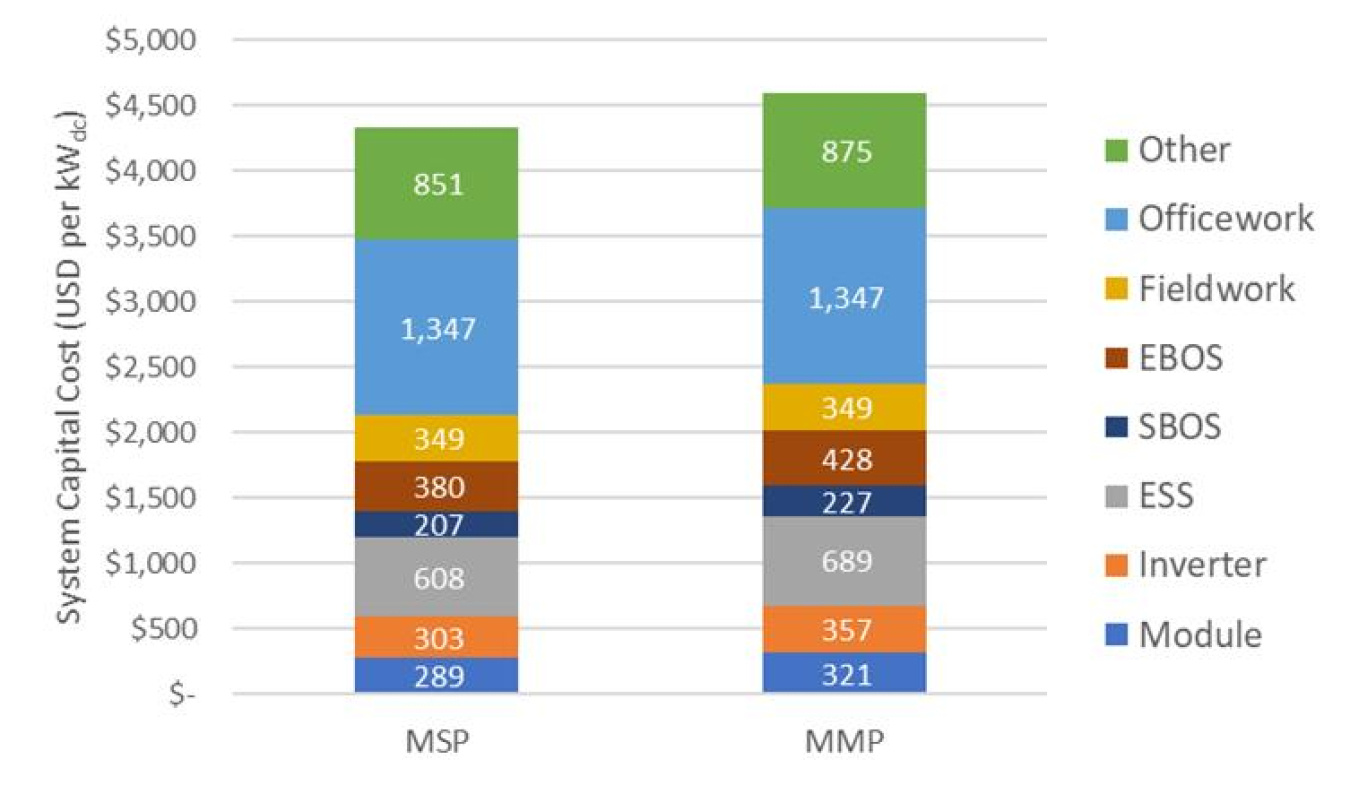
Figure 3 presents the RPV benchmark system cost components by cost category for both MSP and MMP for a system combining 8 kWdc of PV modules with 13.5 kWh of ESS. The cost values represent weighted-average figures based on the data collected by all three participating national laboratories. Details, including O&M, can be found in RPV 2025Q1.txt in the PVSCM ZIP file.
Representative RPV System Description
The representative residential PV system for 2025 has a rating of 8 kWdc (the sum of the system’s module ratings). Each module has a rated power of 400 watts, corresponding to an efficiency of 20.4%. The monofacial modules were assembled in the United States in a plant producing 1.5 GWdc per year, using crystalline silicon solar cells produced in Southeast Asia. In 2025Q1, these cells were subject to AD/CVD duties, but not the Section 201 import tariff. Most of the remaining module components were imported from China and subject to 25% import tariff. The module producer received a 45X tax credit of $70/kWdc in 2025 currency.
Twenty of these modules are mounted on a fixed south-facing rooftop using domestic roof mounts. The aluminum rails and module clamps were imported from China and subject to 25% tariff.
Each module is paired with a microinverter rated at 350 Wac, giving the PV system a rated ac power output of 7.0 kWac, which corresponds to an inverter loading ratio of 1.14. The microinverters are made in the United States in a plant that produces 2 GWac each year. The microinverter producer receives a 45X tax credit of $110/kWac in 2025 currency.
The ESS is a lithium-ion battery cabinet having an energy storage capacity of 13.5 kWh. The ESS cabinet includes a bidirectional inverter rated at 5 kWac. The ESS inverter is ac coupled with the PV microinverters. The ESS system is assembled in the United States using individual battery cells and several other components imported from China subject to 25% import tariff. The ESS producer received a 45X tax credit of $10/kWh in 2025 currency for battery modules.
O&M for the RPV system includes the same cost elements that apply to UPV, except there is no cost to lease the land. Cleaning and inspection are assumed to be performed by the homeowner and a cost associated with their time is included in the model, although most homeowners do not directly acknowledge this cost. The cost of increased property tax and insurance coverage are also included in the model, although these costs are often not assessed to the property owner. Because component replacements occur well into the future, the price of those replacements is based on the MSP of those components, rather than MMP.
Benchmark Summary
Table 1 summarizes this year’s cost benchmarks for PV with ESS. All dollar values are inflation-adjusted to 2024 U.S. dollars. Table 2 shows the cost benchmarks for these systems in the absence of ESS. The benchmark costs do not include subsidies payable to the system owner, which reduce the owner’s effective cost.
Table 1. 2025Q1 PV+ESS Cost Benchmarks
| Type | PV System Size | ESS Size | MSP | MMP | O&M |
|---|---|---|---|---|---|
| UPV | 100 MWdc | 240 MWh | $1.71/Wdc | $1.81/Wdc | $33/kWdc-yr |
| CPV | 250 kWdc | 250 kWh | $2.96/Wdc | $2.98/Wdc | $67/kWdc-yr |
| RPV | 8 kWdc | 13.5 kWh | $4.33/Wdc | $4.59/Wdc | $64/kWdc-yr |
Table 2. 2025Q1 PV-Only Cost Benchmarks
| Type | PV System Size | MSP | MMP | O&M |
|---|---|---|---|---|
| UPV | 100 MWdc | $1.07/Wdc | $1.12/Wdc | $20/kWdc-yr |
| CPV | 250 kWdc | $1.95/Wdc | $1.98/Wdc | $40/kWdc-yr |
| RPV | 8 kWdc | $2.78/Wdc | $2.95/Wdc | $34/kWdc-yr |
Contributors
DOE: Paul Basore (technology manager), Krysta Dummit, Andy Thomas
Lawrence Berkeley National Laboratory: Margaret Taylor (principal investigator), Peter Benoliel
National Laboratory of the Rockies: David Feldman (principal investigator), Meenakshi Narayanaswami, Vignesh Ramasamy, Michael Woodhouse, Jarett Zuboy
Sandia National Laboratories: Jennifer Braid (principal investigator), Norman Jost, Evan Sproul
Sign up to receive the latest news, updates, and opportunities from the Integrated Energy Systems Office.