
SUBSCRIBE to the Fact of the Week
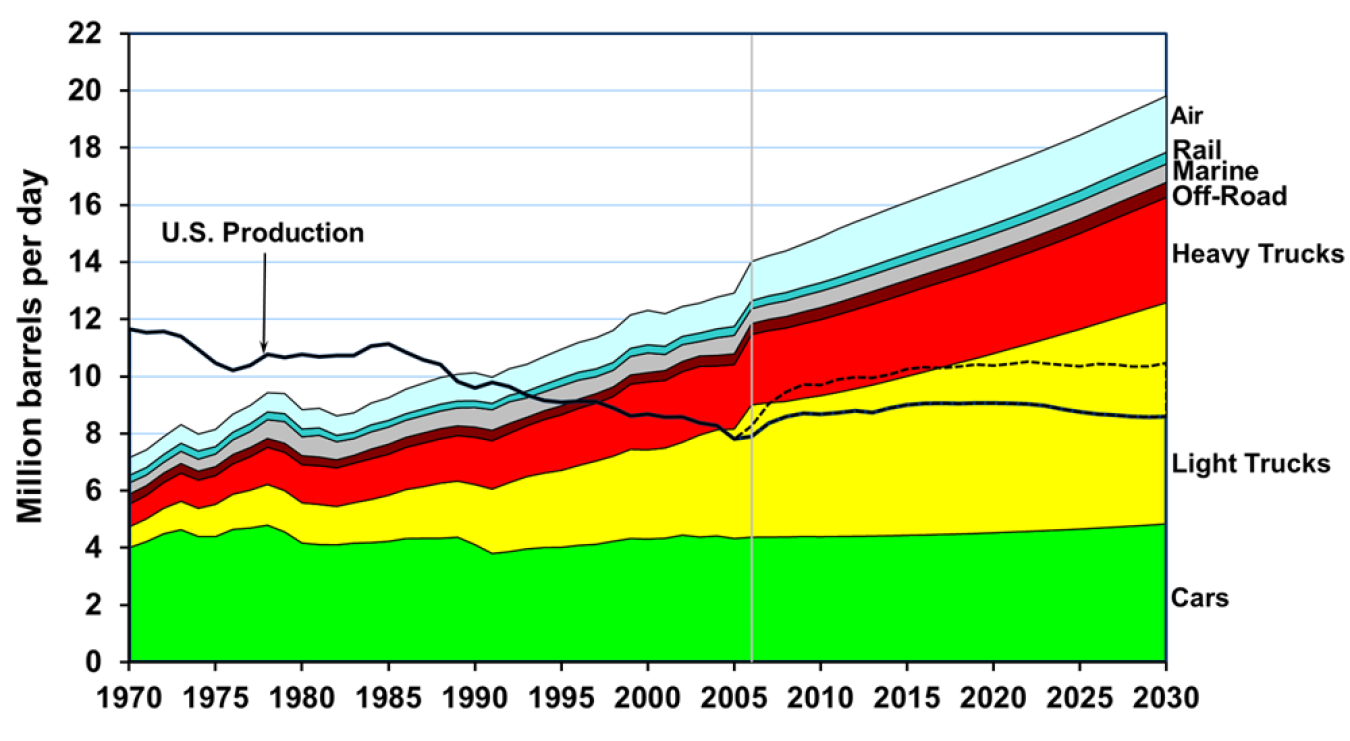
In 1989 the transportation sector’s petroleum consumption surpassed U.S. petroleum production for the first time, creating a gap that had to be met with imports of petroleum. The 2007 Annual Energy Outlook (AEO) prediction from the Energy Information Administration showed increasing consumption by transportation and steady petroleum production, so that by the year 2030, the transportation sector would consume nearly twice the amount of U.S. petroleum production (see first graph).
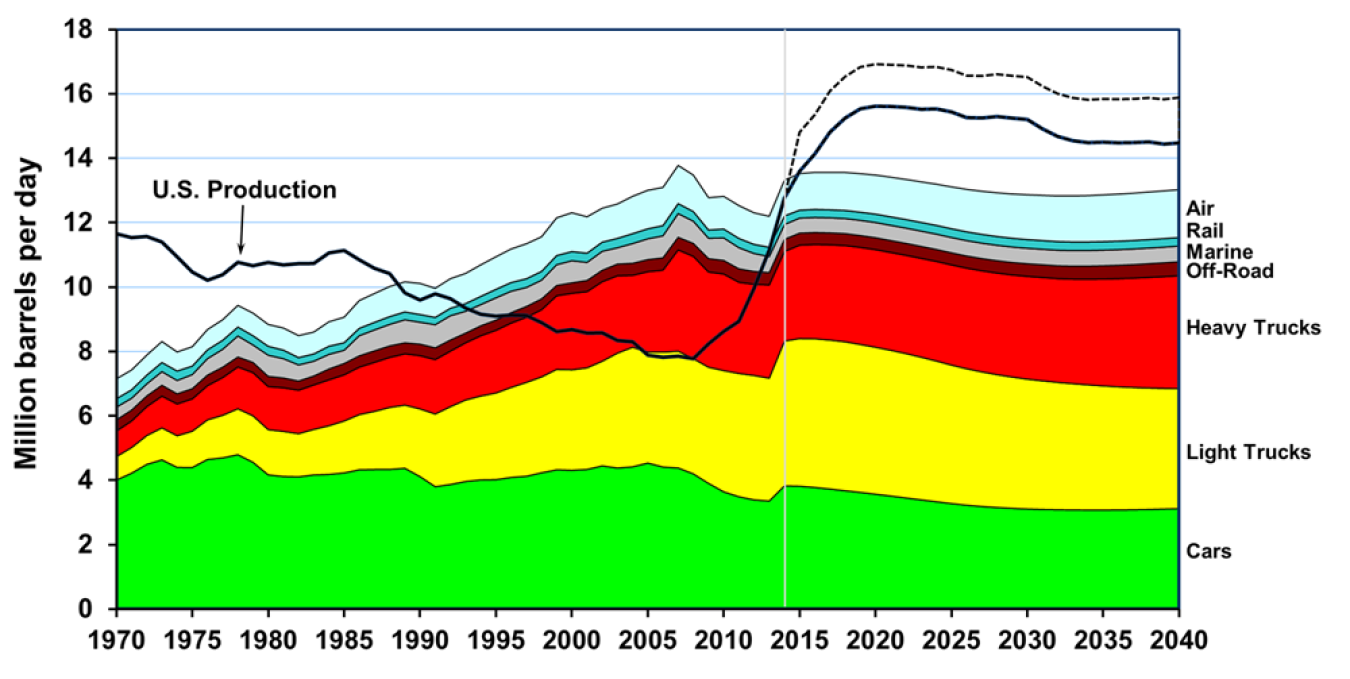
In 2009 the U.S. production of petroleum began to increase and the same graph created today, using the 2015 Annual Energy Outlook, is much different than the first (see second graph). Petroleum production is expected to be nearly equal to transportation consumption in 2015 and projected to exceed it thereafter. When including non-petroleum sources (ethanol, biomass, etc.), the production will exceed transportation demand by about 2.3 million barrels per day in 2040.
2007 Edition of the Petroleum Gap Chart with Historical Data from 1970-2005 and AEO2007 Projections from 2006-2030
Notes:
- The U.S. production has two lines after 2005. The solid line is conventional sources of petroleum, including crude oil, natural gas plant liquids, and refinery gains. The dashed line adds in other non-petroleum sources, including ethanol, biomass, liquids from coal, other blending components, other hydrocarbons, and ethers.
- The sharp increase in consumption values between 2005 and 2006 are caused by the data change from historical to projected values and is denoted by a gray vertical line.
2015 Edition of the Petroleum Gap Chart with Historical Data from 1970-2014 and AEO2015 Projections from 2014-2040
Notes:
- The U.S. production has two lines after 2014. The solid line is conventional sources of petroleum, including crude oil, natural gas plant liquids, and refinery gains. The dashed line adds in other non-petroleum sources, including ethanol, biomass, liquids from coal, other blending components, other hydrocarbons, and ethers.
- The sharp increase in consumption values between 2013 and 2014 are caused by the data change from historical to projected values and is denoted by a gray vertical line.
- The sharp increase in the consumption value for heavy trucks between 2006 and 2007 is the result of the FHWA’s methodology change.
Supporting Information
| Year | Autos | Light Trucks | Medium & Heavy Trucks | Air | Water | Off-Highway | Rail | Pipeline | Total | U.S Production | U.S. Production with other inputs (dotted line) |
|---|---|---|---|---|---|---|---|---|---|---|---|
| 1970 | 4.01 | 0.73 | 0.79 | 0.62 | 0.40 | 0.35 | 0.26 | 0.47 | 7.62 | 11.66 | |
| 1971 | 4.22 | 0.80 | 0.82 | 0.62 | 0.37 | 0.34 | 0.26 | 0.48 | 7.91 | 11.54 | |
| 1972 | 4.50 | 0.89 | 0.90 | 0.62 | 0.38 | 0.33 | 0.28 | 0.49 | 8.38 | 11.57 | |
| 1973 | 4.63 | 0.99 | 0.99 | 0.65 | 0.43 | 0.34 | 0.29 | 0.47 | 8.79 | 11.40 | |
| 1974 | 4.40 | 0.98 | 0.99 | 0.59 | 0.42 | 0.31 | 0.29 | 0.44 | 8.43 | 10.94 | |
| 1975 | 4.40 | 1.13 | 1.00 | 0.60 | 0.44 | 0.32 | 0.26 | 0.40 | 8.54 | 10.47 | |
| 1976 | 4.65 | 1.23 | 1.06 | 0.63 | 0.51 | 0.33 | 0.27 | 0.38 | 9.06 | 10.21 | |
| 1977 | 4.70 | 1.32 | 1.17 | 0.64 | 0.56 | 0.32 | 0.27 | 0.37 | 9.36 | 10.39 | |
| 1978 | 4.80 | 1.43 | 1.30 | 0.67 | 0.65 | 0.31 | 0.27 | 0.37 | 9.80 | 10.77 | |
| 1979 | 4.56 | 1.44 | 1.34 | 0.70 | 0.76 | 0.32 | 0.28 | 0.41 | 9.81 | 10.66 | |
| 1980 | 4.17 | 1.41 | 1.34 | 0.68 | 0.66 | 0.32 | 0.27 | 0.43 | 9.26 | 10.77 | |
| 1981 | 4.12 | 1.40 | 1.36 | 0.69 | 0.76 | 0.30 | 0.26 | 0.43 | 9.31 | 10.69 | |
| 1982 | 4.11 | 1.34 | 1.35 | 0.68 | 0.63 | 0.28 | 0.22 | 0.41 | 9.03 | 10.73 | |
| 1983 | 4.17 | 1.41 | 1.38 | 0.68 | 0.59 | 0.28 | 0.22 | 0.35 | 9.08 | 10.73 | |
| 1984 | 4.18 | 1.51 | 1.43 | 0.76 | 0.60 | 0.34 | 0.25 | 0.37 | 9.44 | 11.06 | |
| 1985 | 4.23 | 1.61 | 1.43 | 0.79 | 0.60 | 0.35 | 0.23 | 0.36 | 9.61 | 11.14 | |
| 1986 | 4.33 | 1.71 | 1.47 | 0.86 | 0.60 | 0.35 | 0.23 | 0.35 | 9.90 | 10.85 | |
| 1987 | 4.34 | 1.80 | 1.52 | 0.90 | 0.61 | 0.36 | 0.23 | 0.37 | 10.12 | 10.58 | |
| 1988 | 4.34 | 1.93 | 1.55 | 0.93 | 0.62 | 0.36 | 0.24 | 0.41 | 10.38 | 10.42 | |
| 1989 | 4.37 | 1.96 | 1.59 | 0.94 | 0.63 | 0.34 | 0.24 | 0.42 | 10.50 | 9.82 | |
| 1990 | 4.12 | 2.10 | 1.65 | 0.98 | 0.68 | 0.36 | 0.24 | 0.44 | 10.57 | 9.60 | |
| 1991 | 3.80 | 2.26 | 1.69 | 0.92 | 0.72 | 0.36 | 0.22 | 0.41 | 10.38 | 9.79 | |
| 1992 | 3.87 | 2.42 | 1.73 | 0.93 | 0.76 | 0.34 | 0.23 | 0.40 | 10.67 | 9.64 | |
| 1993 | 3.96 | 2.53 | 1.78 | 0.94 | 0.68 | 0.30 | 0.23 | 0.42 | 10.84 | 9.35 | |
| 1994 | 4.01 | 2.61 | 1.87 | 0.98 | 0.66 | 0.31 | 0.26 | 0.45 | 11.15 | 9.16 | |
| 1995 | 4.02 | 2.69 | 1.95 | 1.01 | 0.69 | 0.32 | 0.27 | 0.46 | 11.41 | 9.10 | |
| 1996 | 4.09 | 2.79 | 2.00 | 1.04 | 0.67 | 0.32 | 0.27 | 0.46 | 11.65 | 9.13 | |
| 1997 | 4.13 | 2.91 | 2.02 | 1.09 | 0.59 | 0.34 | 0.27 | 0.49 | 11.83 | 9.12 | |
| 1998 | 4.23 | 2.98 | 2.08 | 1.12 | 0.58 | 0.34 | 0.28 | 0.43 | 12.04 | 8.90 | |
| 1999 | 4.33 | 3.12 | 2.29 | 1.17 | 0.65 | 0.32 | 0.29 | 0.43 | 12.58 | 8.62 | |
| 2000 | 4.31 | 3.12 | 2.37 | 1.20 | 0.69 | 0.33 | 0.29 | 0.43 | 12.74 | 8.68 | |
| 2001 | 4.34 | 3.15 | 2.37 | 1.14 | 0.56 | 0.35 | 0.29 | 0.42 | 12.62 | 8.57 | |
| 2002 | 4.45 | 3.25 | 2.47 | 1.05 | 0.59 | 0.36 | 0.29 | 0.44 | 12.89 | 8.58 | |
| 2003 | 4.38 | 3.57 | 2.40 | 1.05 | 0.51 | 0.36 | 0.30 | 0.40 | 12.97 | 8.37 | |
| 2004 | 4.42 | 3.71 | 2.23 | 1.11 | 0.61 | 0.37 | 0.31 | 0.39 | 13.16 | 8.28 | |
| 2005 | 4.33 | 3.83 | 2.25 | 1.17 | 0.65 | 0.38 | 0.31 | 0.40 | 13.32 | 7.81 | |
| 2006 | 4.38 | 4.63 | 2.46 | 1.37 | 0.52 | 0.38 | 0.28 | 0.39 | 14.41 | 8.26 | |
| 2007 | 4.38 | 4.70 | 2.53 | 1.41 | 0.53 | 0.39 | 0.29 | 0.43 | 14.66 | 8.37 | 9.04 |
| 2008 | 4.38 | 4.74 | 2.57 | 1.46 | 0.55 | 0.40 | 0.29 | 0.44 | 14.84 | 8.59 | 9.46 |
| 2009 | 4.40 | 4.84 | 2.61 | 1.52 | 0.56 | 0.42 | 0.29 | 0.45 | 15.08 | 8.71 | 9.72 |
| 2010 | 4.39 | 4.93 | 2.66 | 1.59 | 0.57 | 0.42 | 0.30 | 0.45 | 15.32 | 8.68 | 9.70 |
| 2011 | 4.40 | 5.04 | 2.72 | 1.69 | 0.58 | 0.42 | 0.30 | 0.46 | 15.61 | 8.73 | 9.89 |
| 2012 | 4.41 | 5.16 | 2.77 | 1.73 | 0.58 | 0.44 | 0.31 | 0.46 | 15.87 | 8.80 | 9.97 |
| 2013 | 4.42 | 5.28 | 2.83 | 1.76 | 0.59 | 0.44 | 0.31 | 0.47 | 16.10 | 8.73 | 9.95 |
| 2014 | 4.43 | 5.42 | 2.87 | 1.79 | 0.59 | 0.45 | 0.32 | 0.47 | 16.34 | 8.89 | 10.07 |
| 2015 | 4.44 | 5.56 | 2.91 | 1.81 | 0.60 | 0.45 | 0.32 | 0.48 | 16.57 | 9.01 | 10.26 |
| 2016 | 4.45 | 5.71 | 2.95 | 1.83 | 0.60 | 0.45 | 0.32 | 0.48 | 16.80 | 9.05 | 10.32 |
| 2017 | 4.47 | 5.85 | 2.99 | 1.85 | 0.60 | 0.46 | 0.33 | 0.48 | 17.03 | 9.07 | 10.29 |
| 2018 | 4.49 | 5.99 | 3.01 | 1.88 | 0.61 | 0.47 | 0.33 | 0.50 | 17.28 | 9.05 | 10.35 |
| 2019 | 4.51 | 6.13 | 3.05 | 1.89 | 0.61 | 0.48 | 0.34 | 0.53 | 17.53 | 9.07 | 10.42 |
| 2020 | 4.53 | 6.27 | 3.09 | 1.91 | 0.61 | 0.48 | 0.34 | 0.54 | 17.78 | 9.07 | 10.38 |
| 2021 | 4.56 | 6.42 | 3.14 | 1.92 | 0.62 | 0.48 | 0.35 | 0.54 | 18.01 | 9.06 | 10.44 |
| 2022 | 4.58 | 6.56 | 3.19 | 1.92 | 0.62 | 0.48 | 0.35 | 0.54 | 18.24 | 9.03 | 10.52 |
| 2023 | 4.60 | 6.70 | 3.24 | 1.93 | 0.62 | 0.49 | 0.36 | 0.54 | 18.49 | 8.97 | 10.45 |
| 2024 | 4.63 | 6.85 | 3.29 | 1.93 | 0.63 | 0.50 | 0.37 | 0.54 | 18.74 | 8.85 | 10.40 |
| 2025 | 4.66 | 6.99 | 3.35 | 1.93 | 0.63 | 0.50 | 0.37 | 0.54 | 18.98 | 8.76 | 10.35 |
| 2026 | 4.69 | 7.15 | 3.42 | 1.94 | 0.63 | 0.50 | 0.38 | 0.54 | 19.26 | 8.68 | 10.44 |
| 2027 | 4.73 | 7.30 | 3.49 | 1.94 | 0.63 | 0.51 | 0.39 | 0.54 | 19.53 | 8.65 | 10.42 |
| 2028 | 4.76 | 7.45 | 3.56 | 1.95 | 0.64 | 0.51 | 0.40 | 0.54 | 19.80 | 8.60 | 10.35 |
| 2029 | 4.80 | 7.60 | 3.62 | 1.96 | 0.64 | 0.52 | 0.40 | 0.54 | 20.08 | 8.58 | 10.35 |
| 2030 | 4.84 | 7.74 | 3.69 | 1.97 | 0.64 | 0.52 | 0.41 | 0.54 | 20.35 | 8.59 | 10.47 |
Source: Oak Ridge National Laboratory, Transportation Energy Data Book: Edition 26, Figure 1.8, September 2015. | |||||||||||
| Year | Autos | Light Trucks | Medium & Heavy Trucks | Air | Water | Off-Highway | Rail | Pipeline | Total | U.S Production | U.S. Production with other inputs (dotted line) |
|---|---|---|---|---|---|---|---|---|---|---|---|
| 1970 | 4.01 | 0.73 | 0.79 | 0.62 | 0.40 | 0.35 | 0.26 | 0.47 | 7.62 | 11.66 | |
| 1971 | 4.22 | 0.80 | 0.83 | 0.62 | 0.37 | 0.34 | 0.26 | 0.48 | 7.90 | 11.54 | |
| 1972 | 4.50 | 0.89 | 0.90 | 0.62 | 0.37 | 0.33 | 0.27 | 0.49 | 8.38 | 11.57 | |
| 1973 | 4.64 | 0.99 | 0.99 | 0.65 | 0.42 | 0.34 | 0.28 | 0.47 | 8.78 | 11.40 | |
| 1974 | 4.40 | 0.98 | 0.99 | 0.59 | 0.42 | 0.31 | 0.29 | 0.44 | 8.43 | 10.94 | |
| 1975 | 4.40 | 1.13 | 1.01 | 0.60 | 0.44 | 0.32 | 0.26 | 0.40 | 8.55 | 10.47 | |
| 1976 | 4.65 | 1.23 | 1.06 | 0.63 | 0.51 | 0.33 | 0.27 | 0.38 | 9.06 | 10.21 | |
| 1977 | 4.70 | 1.32 | 1.17 | 0.64 | 0.56 | 0.32 | 0.28 | 0.37 | 9.36 | 10.39 | |
| 1978 | 4.80 | 1.43 | 1.30 | 0.67 | 0.65 | 0.31 | 0.28 | 0.37 | 9.80 | 10.77 | |
| 1979 | 4.56 | 1.44 | 1.34 | 0.70 | 0.54 | 0.32 | 0.29 | 0.41 | 9.60 | 10.66 | |
| 1980 | 4.17 | 1.41 | 1.34 | 0.68 | 0.66 | 0.32 | 0.28 | 0.42 | 9.26 | 10.77 | |
| 1981 | 4.12 | 1.40 | 1.36 | 0.69 | 0.60 | 0.31 | 0.27 | 0.43 | 9.16 | 10.69 | |
| 1982 | 4.11 | 1.34 | 1.35 | 0.68 | 0.50 | 0.28 | 0.23 | 0.40 | 8.90 | 10.73 | |
| 1983 | 4.17 | 1.41 | 1.38 | 0.68 | 0.46 | 0.28 | 0.23 | 0.35 | 8.95 | 10.73 | |
| 1984 | 4.19 | 1.51 | 1.43 | 0.76 | 0.46 | 0.34 | 0.25 | 0.37 | 9.29 | 11.06 | |
| 1985 | 4.23 | 1.61 | 1.43 | 0.79 | 0.41 | 0.35 | 0.24 | 0.36 | 9.42 | 11.14 | |
| 1986 | 4.33 | 1.71 | 1.47 | 0.86 | 0.63 | 0.35 | 0.23 | 0.35 | 9.93 | 10.85 | |
| 1987 | 4.34 | 1.80 | 1.52 | 0.90 | 0.65 | 0.36 | 0.24 | 0.37 | 10.17 | 10.58 | |
| 1988 | 4.34 | 1.93 | 1.55 | 0.93 | 0.67 | 0.36 | 0.24 | 0.41 | 10.43 | 10.42 | |
| 1989 | 4.37 | 1.96 | 1.59 | 0.94 | 0.72 | 0.34 | 0.24 | 0.42 | 10.59 | 9.82 | |
| 1990 | 4.12 | 2.10 | 1.65 | 0.97 | 0.68 | 0.36 | 0.24 | 0.44 | 10.55 | 9.60 | |
| 1991 | 3.80 | 2.26 | 1.69 | 0.91 | 0.72 | 0.37 | 0.23 | 0.41 | 10.37 | 9.79 | |
| 1992 | 3.87 | 2.42 | 1.73 | 0.92 | 0.76 | 0.35 | 0.23 | 0.40 | 10.66 | 9.64 | |
| 1993 | 3.96 | 2.53 | 1.78 | 0.94 | 0.68 | 0.30 | 0.24 | 0.42 | 10.84 | 9.35 | |
| 1994 | 4.01 | 2.61 | 1.87 | 0.98 | 0.66 | 0.31 | 0.25 | 0.45 | 11.14 | 9.16 | |
| 1995 | 4.02 | 2.69 | 1.95 | 1.01 | 0.69 | 0.32 | 0.26 | 0.46 | 11.40 | 9.10 | |
| 1996 | 4.09 | 2.80 | 2.00 | 1.04 | 0.67 | 0.32 | 0.27 | 0.46 | 11.65 | 9.13 | |
| 1997 | 4.13 | 2.91 | 2.02 | 1.09 | 0.59 | 0.34 | 0.27 | 0.48 | 11.83 | 9.12 | |
| 1998 | 4.23 | 2.98 | 2.09 | 1.08 | 0.58 | 0.34 | 0.27 | 0.42 | 11.99 | 8.90 | |
| 1999 | 4.33 | 3.12 | 2.29 | 1.17 | 0.65 | 0.32 | 0.28 | 0.43 | 12.58 | 8.62 | |
| 2000 | 4.31 | 3.12 | 2.38 | 1.21 | 0.69 | 0.33 | 0.28 | 0.43 | 12.74 | 8.68 | |
| 2001 | 4.34 | 3.15 | 2.37 | 1.13 | 0.56 | 0.35 | 0.29 | 0.42 | 12.60 | 8.57 | |
| 2002 | 4.45 | 3.25 | 2.47 | 1.05 | 0.59 | 0.36 | 0.29 | 0.44 | 12.89 | 8.58 | |
| 2003 | 4.38 | 3.57 | 2.40 | 1.07 | 0.51 | 0.36 | 0.29 | 0.40 | 12.98 | 8.34 | |
| 2004 | 4.42 | 3.71 | 2.23 | 1.16 | 0.61 | 0.37 | 0.31 | 0.39 | 13.21 | 8.30 | |
| 2005 | 4.54 | 3.45 | 2.50 | 1.20 | 0.65 | 0.38 | 0.31 | 0.40 | 13.41 | 7.89 | |
| 2006 | 4.41 | 3.57 | 2.55 | 1.19 | 0.69 | 0.38 | 0.32 | 0.40 | 13.49 | 7.82 | |
| 2007 | 4.38 | 3.63 | 3.14 | 1.19 | 0.74 | 0.39 | 0.31 | 0.42 | 14.20 | 7.86 | |
| 2008 | 4.20 | 3.58 | 3.18 | 1.13 | 0.69 | 0.40 | 0.30 | 0.43 | 13.91 | 7.78 | |
| 2009 | 3.91 | 3.61 | 2.96 | 1.01 | 0.63 | 0.42 | 0.26 | 0.44 | 13.22 | 8.24 | |
| 2010 | 3.64 | 3.77 | 3.00 | 1.02 | 0.70 | 0.42 | 0.27 | 0.44 | 13.26 | 8.62 | |
| 2011 | 3.49 | 3.83 | 2.83 | 1.02 | 0.66 | 0.42 | 0.29 | 0.45 | 12.98 | 8.94 | |
| 2012 | 3.39 | 3.86 | 2.83 | 0.98 | 0.56 | 0.40 | 0.28 | 0.47 | 12.78 | 9.96 | |
| 2013 | 3.36 | 3.82 | 2.90 | 0.96 | 0.50 | 0.38 | 0.29 | 0.54 | 12.74 | 11.15 | |
| 2014 | 3.83 | 4.50 | 2.78 | 1.11 | 0.46 | 0.38 | 0.27 | 0.56 | 13.88 | 12.77 | |
| 2015 | 3.82 | 4.58 | 2.90 | 1.14 | 0.47 | 0.37 | 0.25 | 0.50 | 14.02 | 13.60 | 14.81 |
| 2016 | 3.78 | 4.62 | 2.93 | 1.15 | 0.47 | 0.37 | 0.25 | 0.58 | 14.14 | 14.14 | 15.35 |
| 2017 | 3.73 | 4.63 | 2.96 | 1.16 | 0.47 | 0.37 | 0.25 | 0.55 | 14.11 | 14.81 | 16.09 |
| 2018 | 3.68 | 4.63 | 2.99 | 1.18 | 0.47 | 0.37 | 0.25 | 0.53 | 14.09 | 15.25 | 16.54 |
| 2019 | 3.63 | 4.60 | 3.01 | 1.20 | 0.47 | 0.37 | 0.25 | 0.54 | 14.06 | 15.54 | 16.84 |
| 2020 | 3.57 | 4.56 | 3.03 | 1.21 | 0.47 | 0.37 | 0.26 | 0.54 | 14.02 | 15.62 | 16.92 |
| 2021 | 3.51 | 4.53 | 3.04 | 1.23 | 0.47 | 0.37 | 0.26 | 0.55 | 13.96 | 15.61 | 16.90 |
| 2022 | 3.45 | 4.48 | 3.05 | 1.25 | 0.47 | 0.37 | 0.27 | 0.55 | 13.90 | 15.58 | 16.89 |
| 2023 | 3.39 | 4.43 | 3.07 | 1.26 | 0.48 | 0.37 | 0.27 | 0.56 | 13.83 | 15.52 | 16.82 |
| 2024 | 3.34 | 4.37 | 3.09 | 1.28 | 0.48 | 0.37 | 0.27 | 0.57 | 13.76 | 15.54 | 16.84 |
| 2025 | 3.28 | 4.30 | 3.11 | 1.30 | 0.48 | 0.37 | 0.27 | 0.57 | 13.68 | 15.44 | 16.74 |
| 2026 | 3.23 | 4.24 | 3.13 | 1.32 | 0.48 | 0.38 | 0.27 | 0.57 | 13.61 | 15.26 | 16.57 |
| 2027 | 3.19 | 4.18 | 3.14 | 1.34 | 0.48 | 0.38 | 0.27 | 0.58 | 13.56 | 15.25 | 16.56 |
| 2028 | 3.16 | 4.13 | 3.15 | 1.36 | 0.48 | 0.38 | 0.27 | 0.59 | 13.52 | 15.30 | 16.61 |
| 2029 | 3.13 | 4.08 | 3.17 | 1.38 | 0.48 | 0.39 | 0.27 | 0.59 | 13.49 | 15.25 | 16.56 |
| 2030 | 3.11 | 4.03 | 3.19 | 1.39 | 0.48 | 0.39 | 0.27 | 0.60 | 13.46 | 15.21 | 16.52 |
| 2031 | 3.10 | 3.99 | 3.21 | 1.41 | 0.48 | 0.40 | 0.27 | 0.60 | 13.45 | 14.91 | 16.24 |
| 2032 | 3.09 | 3.95 | 3.22 | 1.42 | 0.48 | 0.40 | 0.27 | 0.60 | 13.43 | 14.68 | 16.01 |
| 2033 | 3.08 | 3.92 | 3.25 | 1.43 | 0.48 | 0.40 | 0.27 | 0.60 | 13.43 | 14.55 | 15.88 |
| 2034 | 3.08 | 3.89 | 3.28 | 1.44 | 0.48 | 0.41 | 0.27 | 0.60 | 13.44 | 14.49 | 15.82 |
| 2035 | 3.08 | 3.85 | 3.32 | 1.45 | 0.48 | 0.41 | 0.27 | 0.60 | 13.46 | 14.50 | 15.84 |
| 2036 | 3.08 | 3.82 | 3.36 | 1.46 | 0.49 | 0.42 | 0.26 | 0.60 | 13.49 | 14.48 | 15.84 |
| 2037 | 3.09 | 3.80 | 3.40 | 1.47 | 0.49 | 0.42 | 0.26 | 0.60 | 13.52 | 14.49 | 15.84 |
| 2038 | 3.10 | 3.77 | 3.44 | 1.48 | 0.49 | 0.43 | 0.26 | 0.61 | 13.56 | 14.51 | 15.88 |
| 2039 | 3.11 | 3.75 | 3.47 | 1.48 | 0.49 | 0.43 | 0.26 | 0.61 | 13.60 | 14.44 | 15.83 |
| 2040 | 3.12 | 3.73 | 3.51 | 1.49 | 0.49 | 0.44 | 0.26 | 0.61 | 13.64 | 14.48 | 15.89 |
Source: Oak Ridge National Laboratory, Transportation Energy Data Book: Edition 34, Figure 1.8, September 2015. | |||||||||||