
SUBSCRIBE to the Fact of the Week
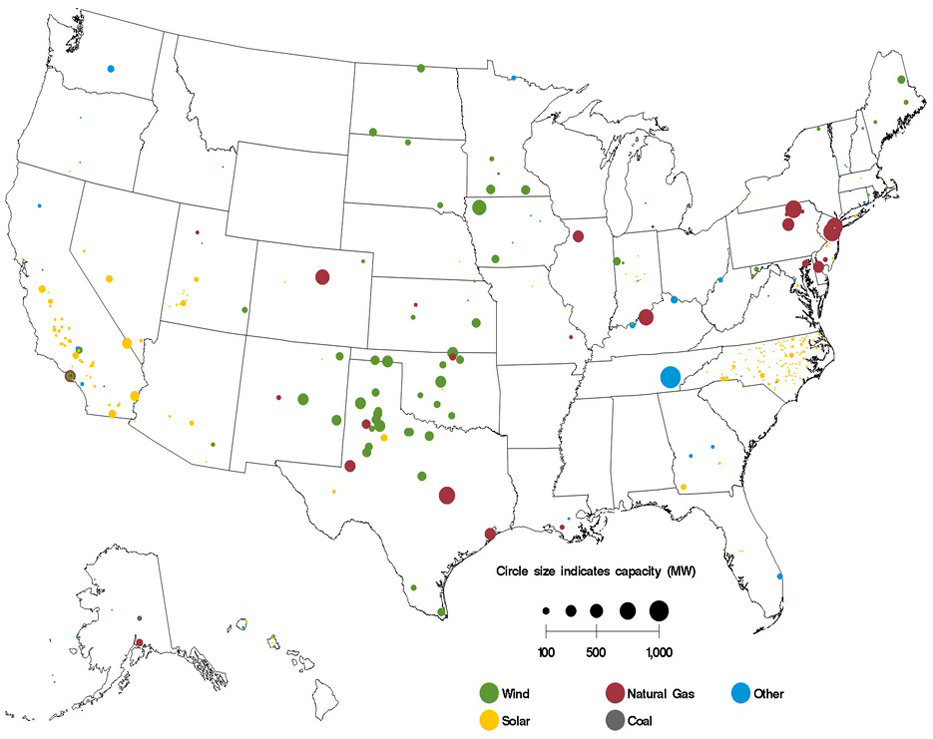
Between April 2015 and March 2016, there is a cumulative total of 88,953 megawatts of new electric utility capacity planned. This new capacity will add to the current U.S. capacity of about 1,071,000 megawatts. Over half (53%) of the new capacity that is planned comes from natural gas while 24% comes from wind and 11% from solar. Just 2% of the new planned capacity comes from coal. Most of the planned wind energy is in the mid-section of the United States extending from Texas to North Dakota. Most of the new solar capacity is in the southwest with the exception of North Carolina which also has a lot of new solar planned—1,652 megawatts which is 16% of all new solar capacity planned from April 2015 to March 2016. During this same timeframe, utility generators representing 40,095 megawatts of capacity are set to retire. Nearly three-fourths (73%) of the capacity being retired is from coal, predominantly in the Midwest and Southeast.
Electricity Generating Units Planned to Come Online from April 2015 to March 2016
Electric Generating Units Planned for Retirement from April 2015 to March 2016
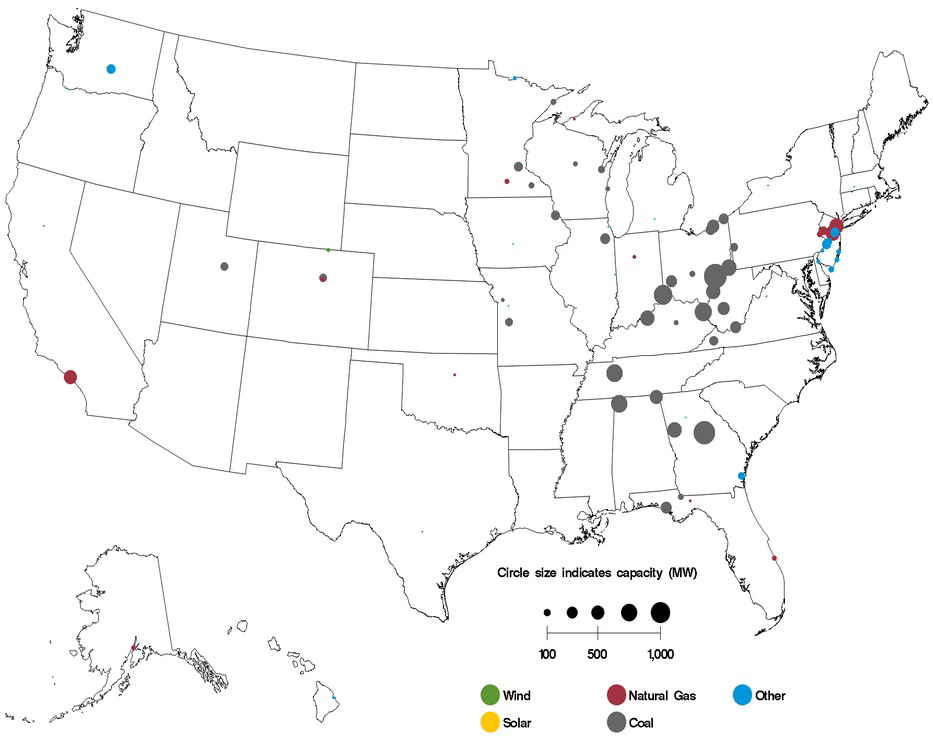
Note: Other includes conventional hydroelectric, geothermal, hydrokinetic, landfill gas, municipal solid waste, nuclear, other gases, other waste biomass, petroleum liquids, batteries, and wood/wood waste biomass.
Supporting Information
| State | Fuel Source | |||||
|---|---|---|---|---|---|---|
| Coal | Natural Gas | Solar | Wind | All Other | Total | |
| Alaska | 67 | 99 | 56 | 222 | ||
| Alabama | 62 | 62 | ||||
| Arizona | 3,875 | 441 | 30 | 4,345 | ||
| California | 413 | 3,106 | 4,707 | 337 | 438 | 9,000 |
| Colorado | 625 | 122 | 228 | 3 | 978 | |
| Connecticut | 90 | 20 | 8 | 118 | ||
| District of Columbia | 10 | 10 | ||||
| Delaware | 309 | 1 | 310 | |||
| Florida | 2,500 | 154 | 100 | 2,753 | ||
| Georgia | 850 | 120 | 2,250 | 3,220 | ||
| Hawaii | 58 | 25 | 18 | 101 | ||
| Iowa | 692 | 692 | 66 | 1,450 | ||
| Idaho | 5 | 40 | 13 | 57 | ||
| Illinois | 571 | 1,341 | 55 | 1,967 | ||
| Indiana | 1,286 | 21 | 270 | 5 | 1,582 | |
| Kansas | 225 | 723 | 947 | |||
| Kentucky | 1,430 | 10 | 270 | 1,710 | ||
| Louisiana | 618 | 15 | 633 | |||
| Massachusetts | 681 | 3 | 8 | 44 | 736 | |
| Maryland | 1,844 | 10 | 230 | 87 | 2,171 | |
| Maine | 55 | 780 | 835 | |||
| Michigan | 143 | 100 | 243 | |||
| Minnesota | 432 | 2 | 646 | 40 | 1,120 | |
| Missouri | 24 | 4 | 28 | |||
| Montana | 371 | 371 | ||||
| North Carolina | 460 | 1,652 | 8 | 2,120 | ||
| North Dakota | 192 | 501 | 693 | |||
| Nebraska | 4 | 411 | 415 | |||
| New Hampshire | 12 | 12 | ||||
| New Jersey | 2,230 | 27 | 2,257 | |||
| New Mexico | 80 | 65 | 728 | 873 | ||
| Nevada | 1,368 | 200 | 25 | 1,593 | ||
| New York | 2 | 1,620 | 19 | 567 | 20 | 2,228 |
| Ohio | 1,991 | 80 | 817 | 2,888 | ||
| Oklahoma | 1,092 | 3 | 2,023 | 3 | 3,121 | |
| Oregon | 2,430 | 5 | 292 | 5 | 2,732 | |
| Pennsylvania | 1 | 4,142 | 100 | 4,244 | ||
| Rhode Island | 44 | 44 | ||||
| South Carolina | 46 | 2,200 | 2,246 | |||
| South Dakota | 178 | 178 | ||||
| Tennessee | 371 | 1,122 | 1,493 | |||
| Texas | 10,124 | 640 | 6,344 | 26 | 17,134 | |
| Utah | 201 | 476 | 182 | 35 | 894 | |
| Virginia | 2,836 | 20 | 12 | 8 | 2,876 | |
| Vermont | 33 | 33 | ||||
| Washington | 126 | 610 | 736 | |||
| Wisconsin | 700 | 98 | 798 | |||
| West Virginia | 355 | 269 | 624 | |||
| Wyoming | 625 | 80 | 3,050 | 3,755 | ||
| Total U.S. | 1,958 | 47,512 | 10,116 | 21,364 | 8,002 | 88,953 |
Source: Energy Information Administration, Electric Power Monthly March 2015, Washington, DC, May 2015, Table 6.5. | ||||||
| State | Fuel Source | |||||
|---|---|---|---|---|---|---|
| Coal | Natural Gas | Solar | Wind | All Other | Total | |
| Alaska | 44 | 44 | ||||
| Alabama | 1,789 | 56 | 1,845 | |||
| Arizona | 260 | 260 | ||||
| California | 2,004 | 2 | 56 | 9 | 2,071 | |
| Colorado | 336 | 60 | 25 | 421 | ||
| Connecticut | 17 | 17 | ||||
| Florida | 1,568 | 392 | 184 | 2,144 | ||
| Georgia | 2,217 | 115 | 124 | 2,456 | ||
| Hawaii | 180 | 15 | 195 | |||
| Iowa | 418 | 282 | 62 | 762 | ||
| Illinois | 859 | 17 | 876 | |||
| Indiana | 1,954 | 15 | 3 | 1,972 | ||
| Kansas | 54 | 12 | 66 | |||
| Kentucky | 2,951 | 2,951 | ||||
| Louisiana | 95 | 95 | ||||
| Massachusetts | 1,071 | 19 | 435 | 1,525 | ||
| Maryland | 1,196 | 1,196 | ||||
| Michigan | 361 | 55 | 2 | 418 | ||
| Minnesota | 534 | 493 | 218 | 1,244 | ||
| Missouri | 759 | 5 | 764 | |||
| Mississippi | 351 | 351 | ||||
| New Jersey | 1,307 | 1,490 | 2,797 | |||
| New Mexico | 837 | 233 | 1 | 1,071 | ||
| Nevada | 511 | 315 | 6 | 832 | ||
| New York | 55 | 55 | ||||
| Ohio | 2,820 | 13 | 2,833 | |||
| Oklahoma | 942 | 673 | 1,615 | |||
| Oregon | 585 | 5 | 590 | |||
| Pennsylvania | 146 | 146 | ||||
| South Carolina | 250 | 250 | ||||
| Tennessee | 1,206 | 1,206 | ||||
| Texas | 1,368 | 844 | 2,212 | |||
| Utah | 172 | 1 | 173 | |||
| Virginia | 878 | 3 | 881 | |||
| Washington | 670 | 415 | 1,085 | |||
| Wisconsin | 740 | 164 | 193 | 1,096 | ||
| West Virginia | 1,580 | 1,580 | ||||
| Total U.S. | 29,211 | 7,474 | 3 | 82 | 3,325 | 40,095 |
Source: Energy Information Administration, Electric Power Monthly March 2015, Washington, DC, May 2015, Table 6.6. | ||||||