
The used vehicle Consumer Price Index (CPI) in 2018 was 4.4 times higher than in 1970, while the new vehicle CPI was 2.8 times higher.
Transportation Technologies Office
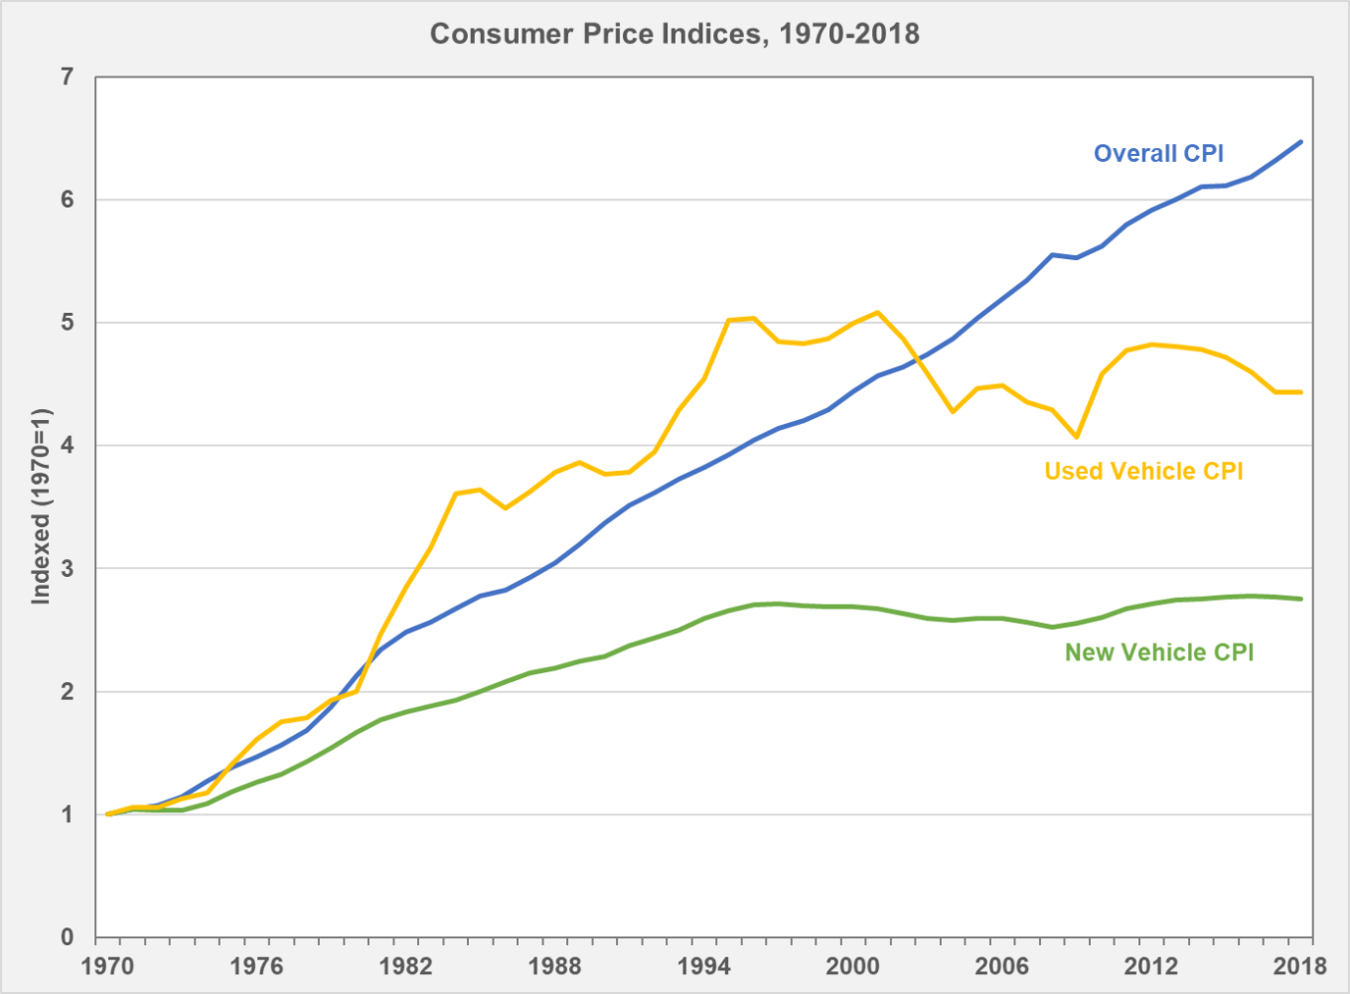
July 22, 2019The used vehicle Consumer Price Index (CPI) in 2018 was 4.4 times higher than in 1970, while the new vehicle CPI was 2.8 times higher, meaning that used-vehicle prices have risen more than new-vehicle prices. Used-vehicle prices were more volatile than new-vehicle prices over the period from 1970 to 2018 and used-vehicle sales are more variable as well. Both new and used-vehicle CPI grew at a slower average rate than the overall CPI. According to the Bureau of Labor Statistics, the CPI is "a measure of the average change over time in the prices paid by urban consumers for a market basket of consumer goods and services."
The new and used-vehicle CPI are calculated by the Bureau of Labor Statistics using consumer transaction prices from surveys of new-vehicle dealerships and the NADA Official Used Car Guide.
Sources: U.S. Department of Labor, Bureau of Labor Statistics, Consumer Price Index Databases, All Urban Consumers (current series) multi-screen data search.
Information on the new vehicle CPI: U.S. Department of Labor, Bureau of Labor Statistics, Measuring Price Change in the CPI: New vehicles.
Information on the used vehicle CPI: U.S. Department of Labor, Bureau of Labor Statistics, Measuring Price Change in the CPI: Used Cars and Trucks.