
Households in the highest income category spent a smaller share on gasoline/motor oil and vehicle insurance than those in other income categories.
Transportation Technologies Office
July 23, 2018When comparing the 2016 share of annual household transportation expenditures across income categories, households in the highest income category ($200,000 and more) spent a smaller share on gasoline/motor oil and vehicle insurance than those in other income categories, but a greater share on vehicle rentals/leases and "public & other transportation" (which includes taxis, airlines, boats, etc.). Although those households with incomes of $200,000 or more had the largest share of new vehicle expenditures, overall vehicle purchase expenditures were about the same as the average for all households (40%). The lowest income category (Less than $15,000) spent the greatest share on gasoline/motor oil and had the highest gasoline/motor oil share of all the income categories.
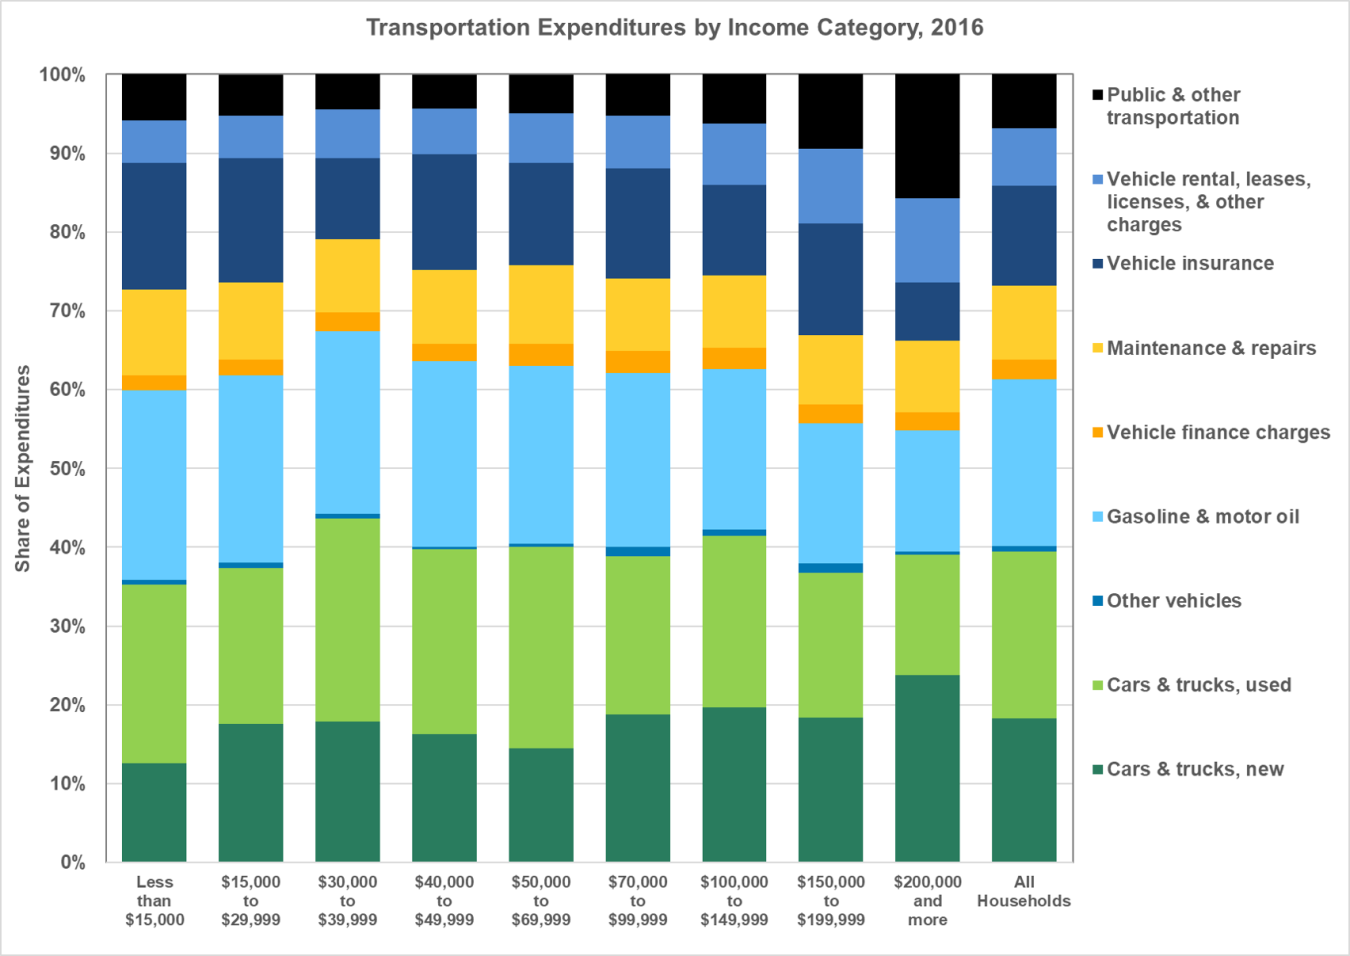
Notes: Overall vehicle purchase expenditures include "Cars & trucks, new," "Cars & trucks, used," and "Other vehicles." "Public & other transportation" includes fares for mass transit, buses, trains, airlines, taxis, school buses for which a fee is charged, and boats.
Source: U.S. Department of Labor, Bureau of Labor Statistics, Consumer Expenditure Survey website query, April 2018.