
The Federal Energy Management Program (FEMP) helps agencies understand the relationship between the facility water cycle and emissions and learn to calculate how water efficiency improvements can lead to overall emission reductions and energy savings.
On This Page
Facility Water Cycle
The facility water cycle describes how water moves through a facility—from supply, to water end-using equipment, to wastewater discharge. Emissions are related to the facility water cycle primarily from the energy (electricity, natural gas, etc.) used for:
- Water heating
- Water distribution
- Water and wastewater treatment.
In addition, wastewater treatment plants produce fugitive emissions, which are emissions such as methane and nitrous oxide that escape from a process.
Figure 1 illustrates the facility water cycle, showing the emissions related to the various stages of the water moving through a typical office building or federal facility for both on-site (within the boundary of the building or facility) and off-site emissions.
- Water end-uses on site—Kitchens, bathrooms, clothes washers, irrigation, vehicle wash stations, on-site water and wastewater treatment (Figure 1 represents a typical office building and therefore does not include water end-uses such as medical equipment or laboratory equipment)
- Water-related processes off site—Water and wastewater treatment
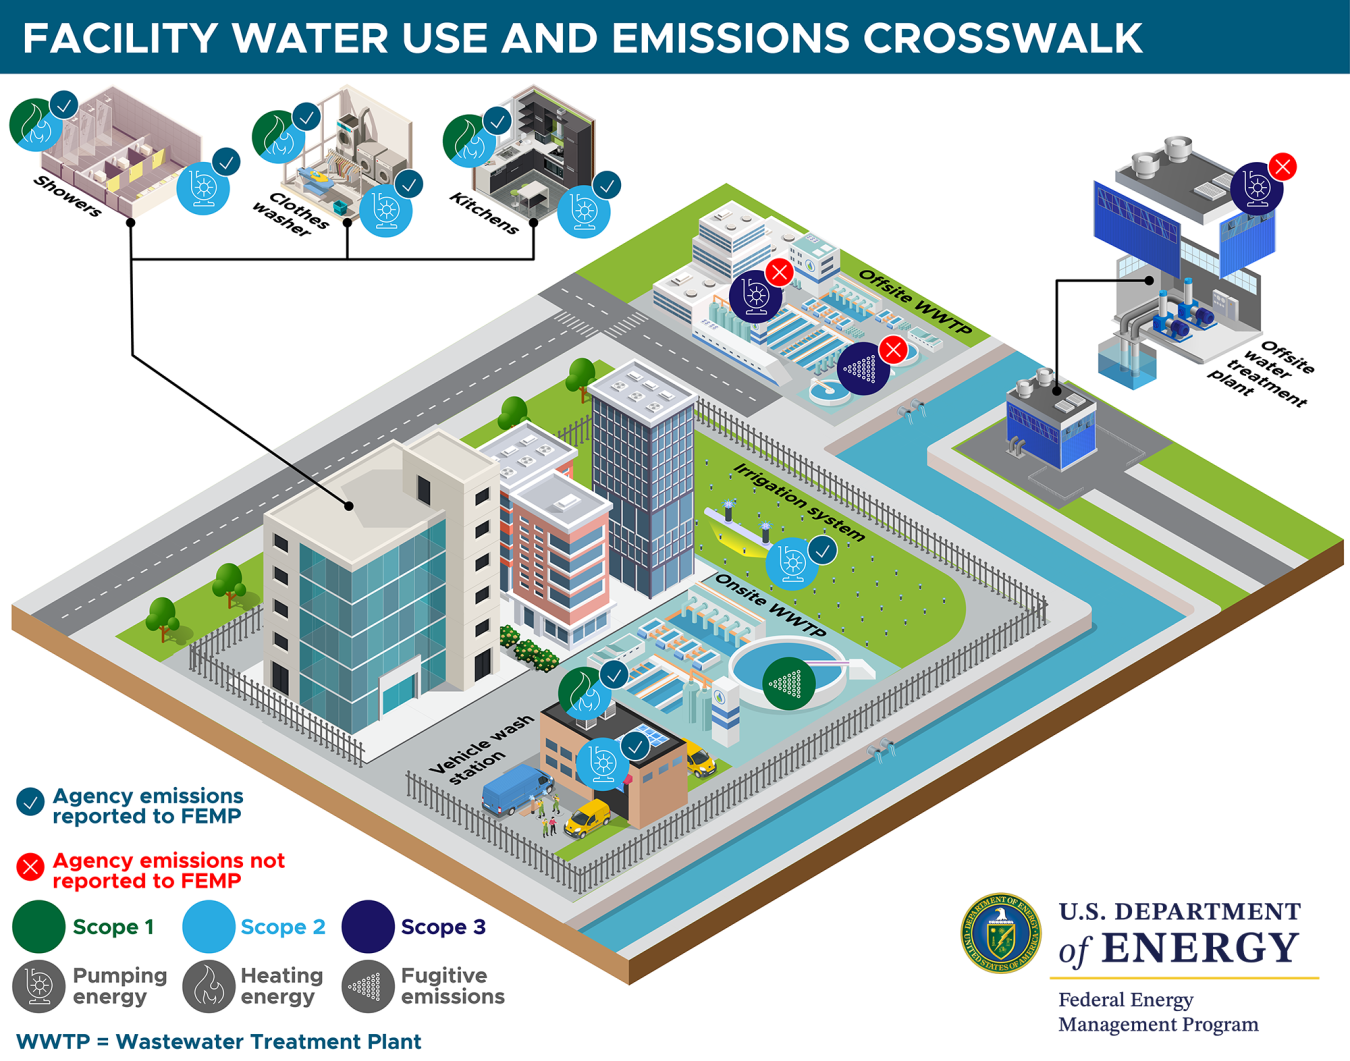
Figure 1. This facility water use and emissions crosswalk shows the facility water cycle in detail, including the components of water end-uses and processes in a federal facility, the emissions associated with water end-uses and processes, and the water-related emissions that are reported to FEMP. Figure 1 also shows the scope of the emissions and if these emissions are reported as part of federal agency requirements.
Illustration from FEMP
Emissions Scopes
Emissions are categorized as scope 1, 2, or 3 to help with reporting and tracking emissions. Read about each scope and learn how it applies to a facility’s water cycle, as shown in Figure 1 above.
Scope 1 Emissions
Scope 1 are direct emissions that occur on site and are owned or controlled by the facility, such as from combusting natural gas.
Water-related examples include:
- Water heating through combustion fuels, like natural gas
- Fugitive emissions from an on-site wastewater treatment plant (WWTP).
Scope 2 Emissions
Scope 2 are emissions that occur off site that the facility directly uses, which is primarily electricity generation.
Water-related uses of off-site grid electricity include:
- On-site pumping—Many buildings are gravity fed, but some large buildings may require on-site pumping for distribution of water and/or regulating pressure.
- Electric water heating
- Treating water or wastewater that occurs on site.
Did You Know?
Electric water heating is classified as scope 2 because its emissions are from electricity consumption. Water heating from combustion fuels (e.g., natural gas, fuel oil) is scope 1 because the emissions occur from on-site combustion of the fuel.
Scope 3 Emissions
Scope 3 emissions are from activities from assets not owned or controlled by the facility, but indirectly affect its value chain upstream or downstream.
Water-related examples include:
- Off-site water and wastewater treatment
- Off-site water distribution.
Table 1 shows the breakdown of emission sources related to water by scope.
Table 1. Emissions Related to Water by Scope
| Source of Emissions | Scope 1 | Scope 2 | Scope 3 |
|---|---|---|---|
| On-site pumping energy and treatment | X | ||
| On-site water heating energya | X | X | |
| On-site fugitive emissions if on-site WWTP | X | ||
| Off-site pumping energy | X | ||
| Off-site fugitive emissions from WWTP | X | ||
| a Electric water heating is classified as scope 2 since its emissions are from electricity consumption. Water heating from combustion fuels (e.g., natural gas, fuel oil) is scope 1 because the emissions occur from on-site combustion of the fuel. | |||
Calculating Emissions from Water End-Uses and Processes
Pacific Northwest National Laboratory (PNNL) worked with FEMP to develop this information and performed high-level estimates of scope 1 and 2 water-related emissions based on previous studies done through federal agencies. These estimates show that emissions related to a facility’s water end-use consumption can represent a wide range (from 5% to 20%) of scope 1 and 2 emissions, depending on water and energy consumption, location, building type, heating system, and more. Emissions related to a facility’s water treatment and distribution (scope 3) emissions are generally less than 3% of a facility’s emissions. This is because most water-related emissions come from on-site heating of water, rather than distribution or treatment.
Understanding that reducing water can also reduce energy/emissions can be additional leverage to promote water efficiency. Also, understanding these synergies can help building managers have a holistic viewpoint when making changes that lead to overall emission reductions and energy savings. Below are steps that can be used to calculate the emissions related to the facility water cycle.
Water consumption by end-use is measured in thousand gallons (kgal).
FEMP's Water Balance Tool is an online software tool that can be used to estimate water use by major water end-uses. Water use can also be determined through metering or comprehensive water assessments.
Use Table 2 and Table 3 to look up your energy-water equivalence metric. This metric describes the energy intensity of water consumption by end-use or process, measured in kilowatt-hours (kWh) per thousand gallons.
Table 2 includes the energy-water equivalence related to heating water for specific end-uses.
Table 3 includes the energy-water equivalence related to water treatment and distribution, and the energy-water equivalence related to wastewater treatment.
The emission factors needed to convert energy to emissions are measured in pounds of carbon dioxide equivalent (lb CO2e) per kilowatt-hour.
If the energy source is electricity—Use eGRID subregional emission factors based on your location.
If the energy source is not electricity—Natural gas, fuel oil, or propane energy from heating water can be converted to emissions using EPA emission factors.
Now that you have water end-use consumption, kilowatt-hours per thousand gallons value by end-use, and your emissions factor, you can use the following formula to calculate water-related emissions, measured in pounds of carbon dioxide equivalent.
initial emissions (lbs CO2e per year)
Subtracting the final from the initial emissions yields the emissions avoided.
final emissions (lbs CO2e per year)=
Water savings can be converted to emissions avoided using the same equation as in Step 4 by focusing on the amount of water saved instead of consumed.
initial emissions (lbs CO2e per year)
With emissions categorized by each water end-use scenario, the next step is to find ways to reduce these emissions by reducing the amount of water consumed.
Example Calculation in Practice
A building manager is looking to install high-efficiency bathroom and kitchen faucets. The building is in California and the energy source is fully electric.
- The building water meter that shows their total water consumption is 2,000 kgal/year. They estimate that the faucets make up 5% of the total water consumption. So, the faucets’ water consumption is roughly 100 kgal/year.
- Using Table 2, they determine that faucets typically use 148.0 kWh/kgal.
- Using eGRID for the region around California, the emissions associated with energy use in the building are found to be 531.68 lb CO2e/MWh, or 0.532 lb CO2e/kWh.
- Calculating the initial emissions for the current faucet fixtures results in 7,873.6 lb CO2e/year.
- The new, high-efficiency faucets decrease water consumption by 30%, meaning that the new faucet water consumption would be 70 kgal/year. With this new faucet water savings, the final emissions would decrease by 30% of the initial emissions, resulting in 2,362.1 lb CO2e avoided.
Water-to-Energy Metrics Tables
Below are generalized energy-water equivalence values (in kilowatt-hours per thousand gallons) from various studies that can be used to calculate the energy related to the distribution, heating, and treatment of water (Griffiths-Sattenspiel and Wilson 2009). Energy from heating is significantly greater than the energy related to treating or distributing and treating water.
Table 2. Heating Energy-Water Equivalence (Griffiths-Sattenspiel and Wilson 2009)
| Heating End-Use | (kWh/kgal) |
|---|---|
| Kitchen dishwashers | 83.5 |
| Prerinse nozzles | 21.0 |
| Shower | 148.8 |
| Bath | 159.2 |
| Faucet | 148.0 |
| Laundry | 35.8 |
| Water-cooled chillers | 207.8 |
| Single-pass coolinga | 0.0 |
| Landscape irrigationa | 0.0 |
| Toilets/urinals a | 0.0 |
| a Elements that do not use heating were considered 0 kWh/kgal by end type in this study since their pumping energy is captured upstream in the distribution. | |
Table 3. Water Supply and Wastewater Energy-Water Equivalence
| Pumping and Treatment of Water | (kWh/kgal) | Sources | |
|---|---|---|---|
| Freshwater | Local surface water | 1.9–4.4 | Lee et al. 2017 Stoughton 2010 Klein, Krebs, Hall, O'Brien, and Blevens 2005 |
| Local groundwater (by depth), 50 ft–200 fta | 3.0–4.4 | Lee et al. 2017 Stoughton 2010 Klein, Krebs, Hall, O'Brien, and Blevens 2005 Dale 2016 PNNL engineered estimates | |
| Distant watershed (by distance), 250 mi–600 mib | 8.0–22.6 | WateReuse Association 2011 U.S. Department of Energy 2014 Klein, Krebs, Hall, O'Brien, and Blevens 2005 PNNL engineered estimates | |
| Alternative Water | On-site harvested rainwater/stormwater | 1.5–9.8 | Vieira 2014 Tjandraamadja, Pollard, Sharma, and Gardner 2011 U.S. Environmental Protection Agency 1999 Collected field data PNNL engineered estimates |
| On-site captured condensate | 1.5–9.8 | Klein, Krebs, Hall, O'Brien, and Blevens 2005 PNNL calculation | |
| On-site reused process discharge water | 2.9–6.5 | WateReuse Association 2011 Taherifar 2015 Klein, Krebs, Hall, O'Brien, and Blevens 2005 U.S. Department of Energy 2014 PNNL engineered estimates | |
| On-site reclaimed wastewater | 7.6–14.7 | Klein, Krebs, Hall, O'Brien, and Blevens 2005 WateReuse Association 2011 Collected field data PNNL engineered estimates | |
| Purchased reclaimed wastewater | 8.4–14.7 | ||
| Wastewater collection and treatment | 0.7–4.6 | Griffiths-Sattenspiel and Wilson 2009 | |
a Depends on the distance, upper range for 200 ft, lower range for 50 ft b Depends on the distance, upper range for 600 mi, lower range for 250 mi | |||
Dale L. 2016. "Clarifying and Quantifying Current and Near-Term Groundwater Pumping Energy Use and Costs in California." Berkeley, CA: Lawrence Berkeley National Laboratory.
Griffiths-Sattenspiel, Bevan, and Wendy Wilson. 2009. The Carbon Footprint of Water. Portland, OR: River Network. https://www.rivernetwork.org/resource/the-carbon-footprint-of-water/.
Klein, Gary, Martha Krebs, Valerie Hall, Terry O'Brien, and B.B. Blevens. 2005. California's Water – Energy Relationship. Sacramento, CA: California Energy Commission. CEC-700-2005-011-SF. http://large.stanford.edu/courses/2012/ph240/spearrin1/docs/CEC-700-2005-011-SF.PDF.
Lee, Mengshan, Arturo A. Keller, Pen-Chi Chiang, Walter Den, Hongtao Wang, Chia-Hung Hou, Jiang Wu, Xin Wang, and Jinyue Yan. 2017. "Water–energy nexus for urban water systems: A comparative review on energy intensity and environmental impacts in relation to global water risks." Applied Energy 205:589-601. https://doi.org/10.1016/j.apenergy.2017.08.002.
Stoughton, Kate McMordie. 2010. "Energy for Water – how much energy is required to supply water?" Richland, WA: Pacific Northwest National Laboratory.
Taherifar, Hossein, Sima Rezvantalab, Fatemeh Bahadori, and Omid Sadrzadeh Khoei. 2015. "Treatments of reverse osmosis concentrate using natural zeolites." Journal of Water and Land Development 25 (IV-VI):41-46. http://archive.sciendo.com/JWLD/jwld.2015.25.issue-1/jwld-2015-0012/jwld-2015-0012.pdf.
Tjandraamadja, Grace, C. Pollard, Ashok Sharma, and Ted Gardner. 2011. "Dissecting Rainwater Pump Energy Use in Urban Households." Science Forum and Stakeholder Engagement: Building Linkages, Collaboration and Science Quality 35. https://www.researchgate.net/publication/266867476_Dissecting_Rainwater_Pump_Energy_Use_in_Urban_Households.