
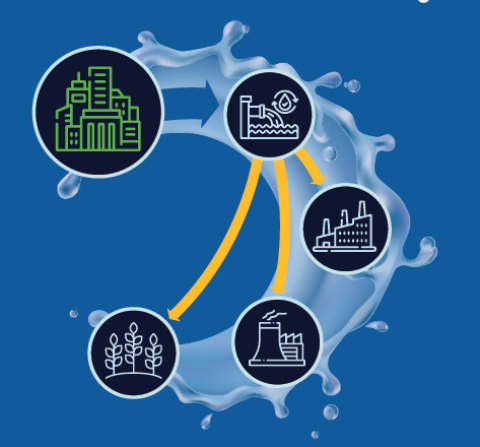
Produced Water: From Waste to Resource
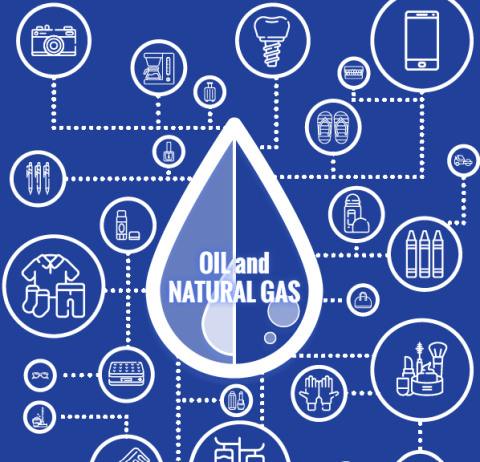
Products Made From Oil and Natural Gas Infographic
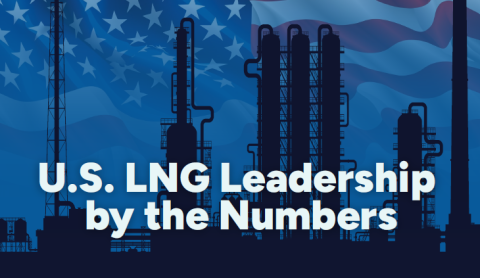
U.S. LNG Leadership by the Numbers.png

11 Things You Should Know About HGEO
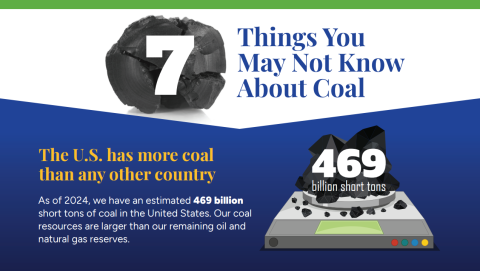
Seven Things You May Not Know About Coal Infographic
The Wabash Valley Resources project in West Terre Haute, Indiana is transforming a coal gasification site into a world-class, low carbon hydrogen and ammonia facility. Download the infographic to learn more.
Liquefied Natural Gas Infographic