
System operators have a new tool for bringing intuition to the deluge of wind data—a visualizer for wind power forecasts called WindView.
Integrated Energy Systems Office
October 21, 2019Software unites forecaster and visualizer to make system operation intuitive
Similar to how a 16th-century sailor interpreted changes in the sky and sea to most effectively harness wind power and keep a ship on course, wind energy system operators now have a tool that makes interpreting wind data more intuitive.
This article is part of the
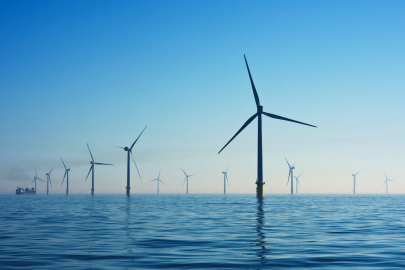
Today’s utility operators need the ability to flex generation to meet load whichever way the wind blows—whether on land or at sea. As wind energy expands both on and offshore and is integrated with other energy systems, its operation is becoming even more complex.
Meeting these challenges requires access to easily navigable and visually coherent forecasts in real time. DOE’s NREL and Argonne National Laboratory (ANL), along with the University of Texas-Dallas, created WindView, a wind power forecast visualization tool that extends the planning capabilities of power system operators and increases their understanding of the dynamics that drive their unique energy systems.
“The important thing for system operators is to develop an intuitive feel for what the wind on their system typically does,” said Bri-Mathias Hodge, chief scientist at NREL. “WindView gives them as much information as possible to make decisions.”
WindView’s visualizations of real-world data support sound judgment, making it possible for operators to take rapid, intuitive action based on scientific fact. The tool combines the cutting-edge machine-learning forecasting techniques (deterministic and probabilistic) of M3, a free forecaster, with a clear presentation of wind data from around the world. WindView users can customize and visualize forecasts, tailoring a dashboard to meet their individual system needs.
“Operators can’t afford to waste time writing a query to find wind power data. WindView gives them the information they need in real time; you can see the wind events as they unfold,” said Erol Chartan, NREL researcher and principal investigator for WindView. The breakthrough visualization tool allows users to leverage much more actionable information from wind power data. System operators can select the most relevant data points and rapidly interpret them for time-sensitive decisions. Above all, WindView’s forecasts complement an operator’s fast-paced and information-intensive responsibilities.
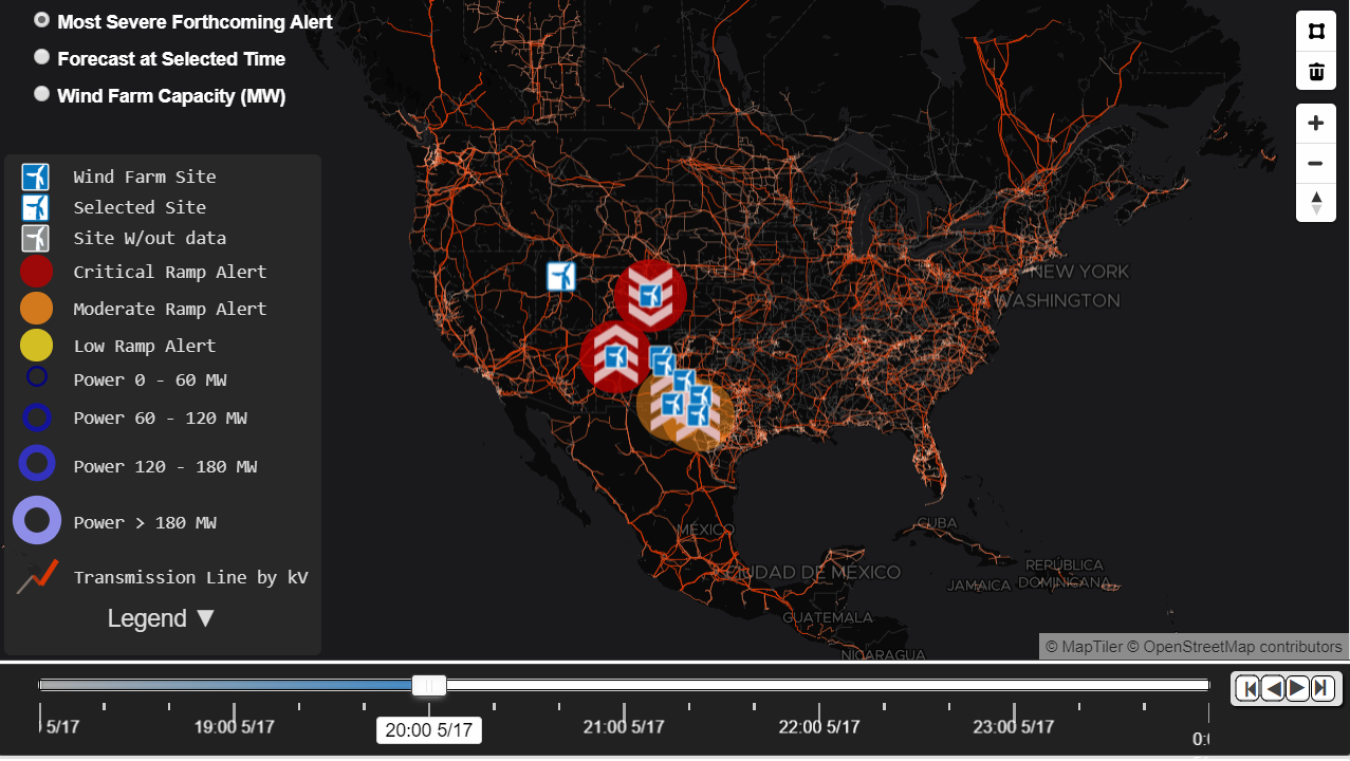
WindView’s beta release is now available for exploration online. A benefit of mapping wind power forecasts geographically is that system operators will gain an understanding of how nearby plants react to conditions. Figure by NREL
“Imagine that a transmission line suddenly goes out,” explained Chartan. “The power system operator then needs to focus on the wind power of that specific area. The user can select that area using WindView’s polygon tool, as well as view the total wind in the aggregated chart at the bottom of the map. Plus, the user can see time and ramping leading to a potential overgeneration event in that region.”
Although there are other forecasting and visualization tools, none offer the features and functionality provided by WindView. Existing wind forecasting tools are often limited in use, with designs that do not allow for intuitive use in the full range of situations encountered by utility operators. WindView’s combination of a map and surrounding charts with user-defined visuals is a game changer on top of its new high-powered forecasting tool.
DOE's Grid Modernization Lab Consortium joined forces with WETO to sponsor the development of WindView by NREL and its partners. As project leads, NREL researchers guided the development of WindView. The team elicited feedback from industry contacts, integrated the M3 forecaster, and designed the user-friendly front end of WindView.
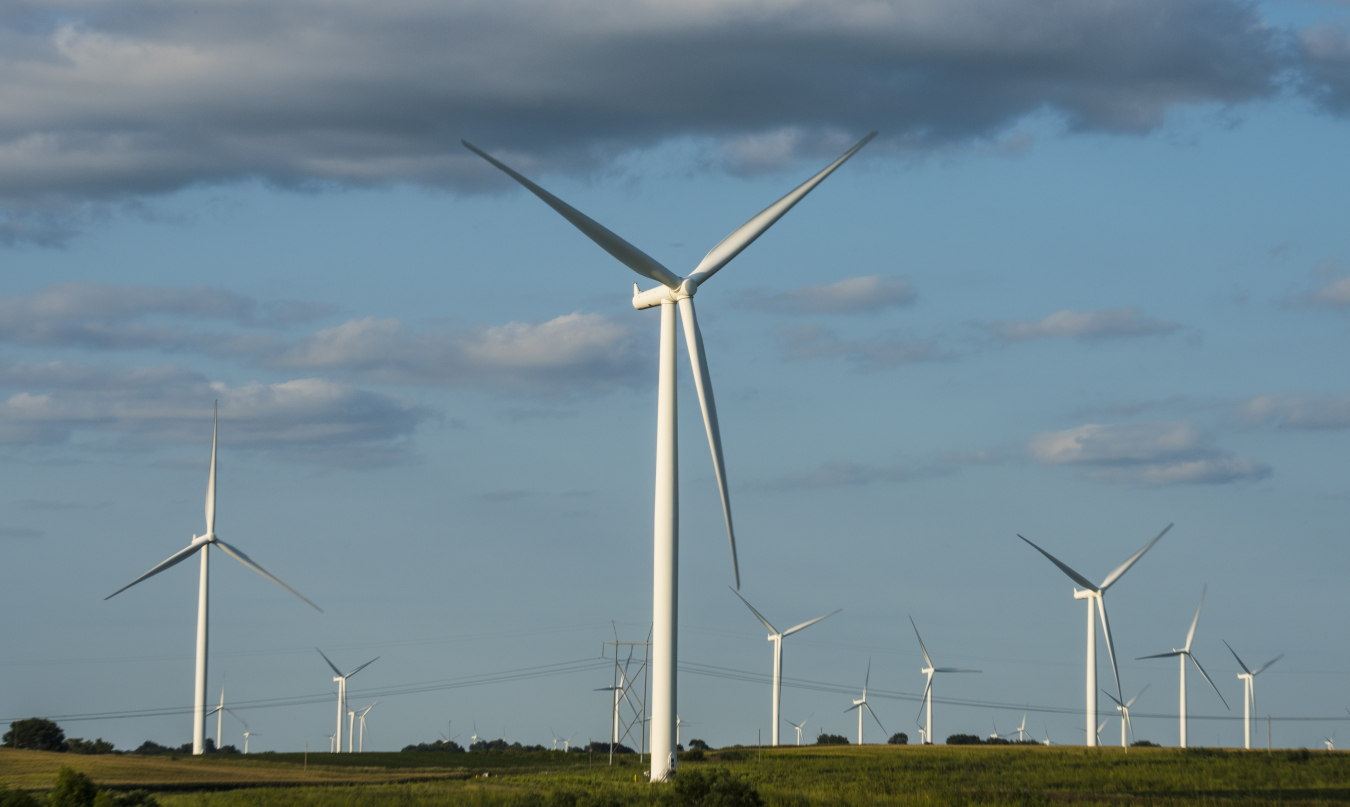
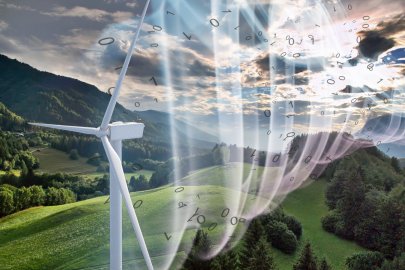
WindView is a new tool for helping system operators understand dynamics on their wind power plant. It unites a newly developed forecaster with a visualization platform, allowing users to customize how they interpret wind forecast data. Photo by NREL
In addition to their support in developing WindView’s multichart forecast comparison, ANL tailored a forecasting tool called ARGUS-PRIMA—which assesses and compares different wind power prediction algorithms—to be compatible with WindView. The University of Texas-Dallas created the M3 machine-learning-based wind power forecaster and worked with NREL to integrate it into WindView’s user interface.
Chartan came to NREL after working on a previous generation of wind power visualization software for Great Britain’s National Grid. Soon, WindView may find its first real-world use in exactly the same control room where Chartan worked.
“From this earlier work, I can so clearly see the strides we’ve made with WindView,” said Chartan. “The map really sets it apart as a forecasting tool. It helps to understand the spatial element, especially alongside up-to-date graphs that are displaying the data you want.”
The DOE’s EERE Solar Energy Technologies Office plans to adapt WindView to meet the forecasting needs of wind’s variable-resource cousin, solar energy. In the meantime, WindView is ready for use by utilities, system operators, researchers, or forecast providers, with a tutorial providing easy instruction on how to use it.
-
 Offshore wind representatives met this spring to discuss meteorology and oceanography research to support offshore wind projects in the U.S.
 -
 With a host of new partners and an open call for research proposals, the $41-million National Offshore Wind R&D Consortium is ready to make a splash.
 -
 Researchers are analyzing alternative blade concepts that could almost double the size of today’s blades.
 -
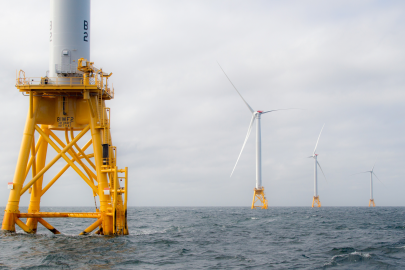
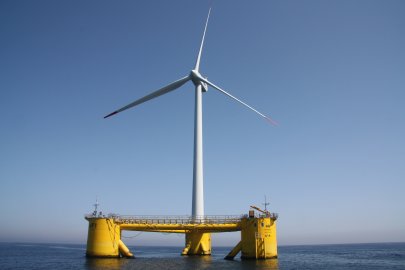 A new scalable offshore floating wind system provides novel solutions to cut costs and overcome challenges of deepwater offshore environments.
 -
 A2e initiative addresses the need to have reliable, applicable wind data by establishing and funding the Data Archive and Portal (DAP).
Explore previous editions of the Wind R&D Newsletter or browse articles by topic: