
SUBSCRIBE to the Fact of the Week
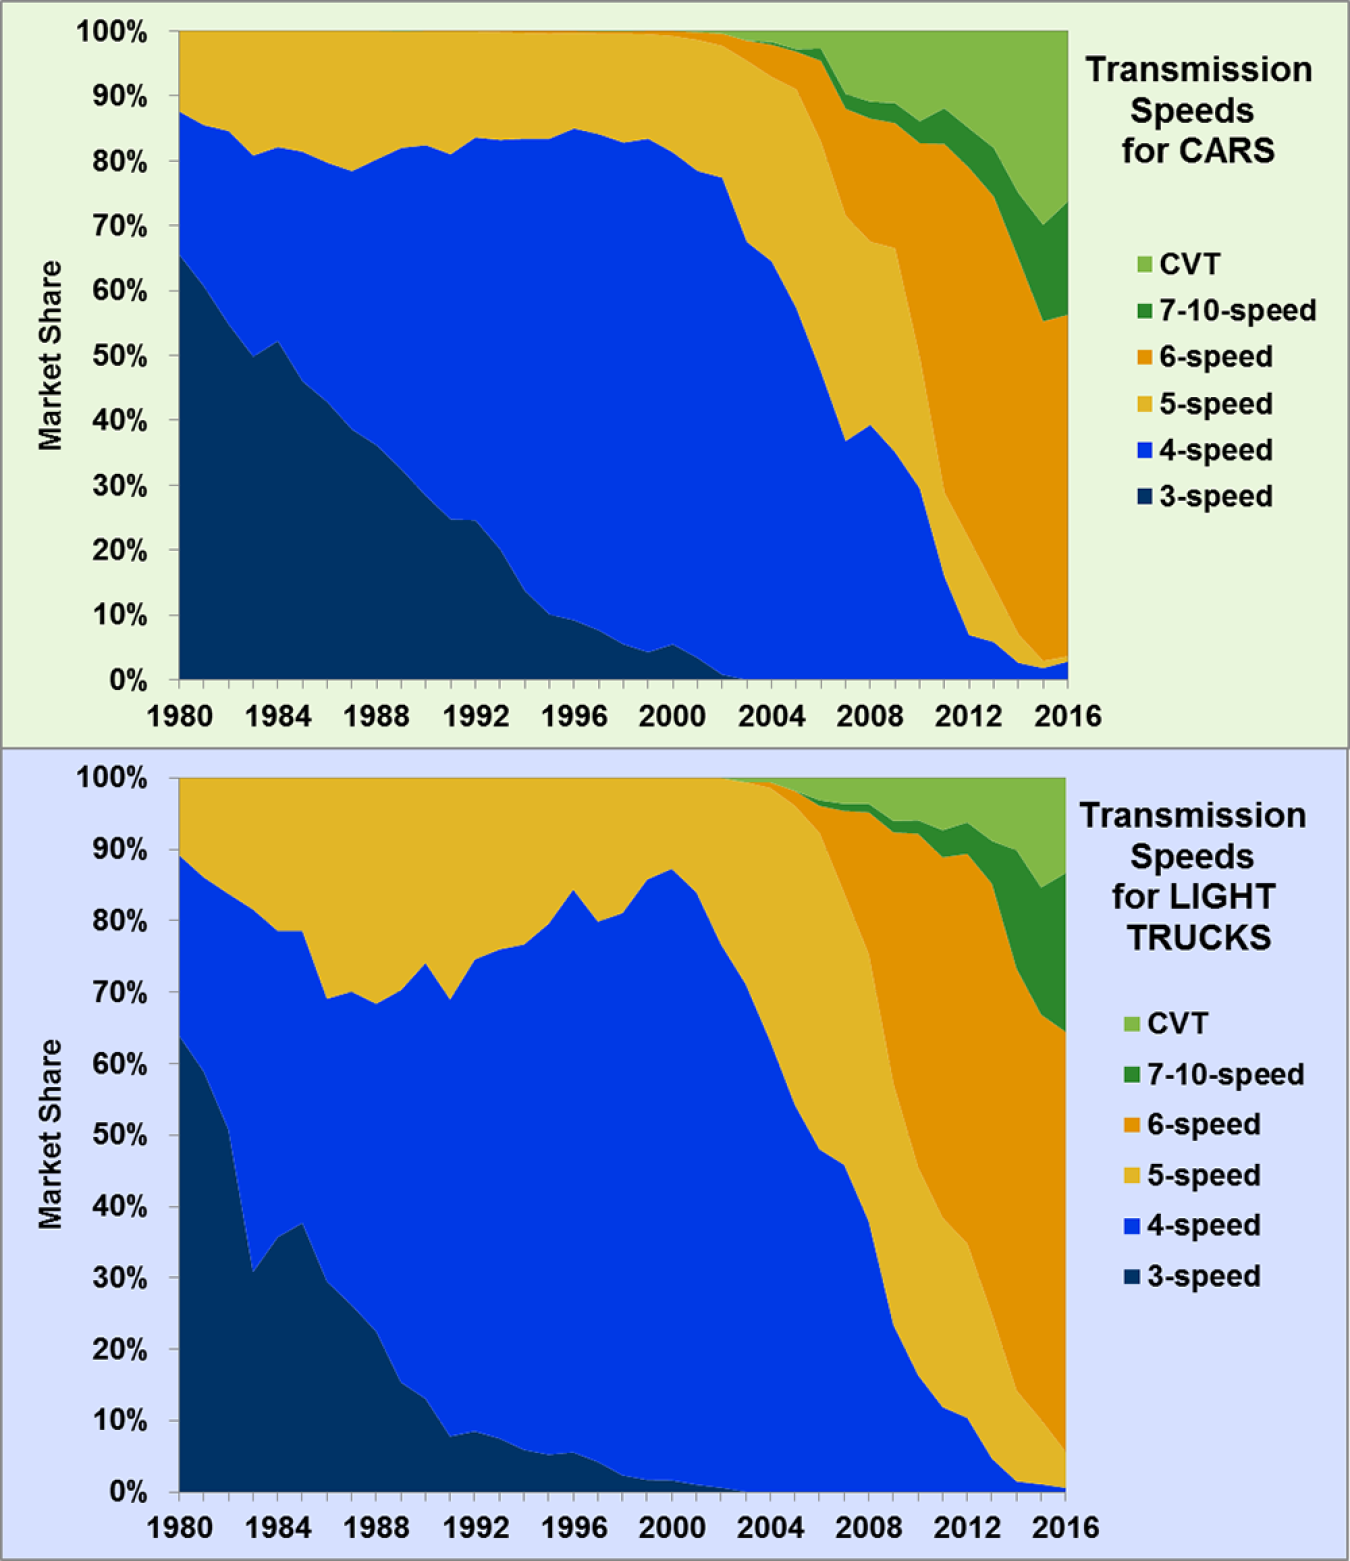
The number of transmission speeds (gears) in new light vehicles has been growing over the last few decades. A greater number of gears improve fuel economy and performance by more closely matching the wheel speed to the optimum engine speed. By 2016, over half of all cars and light trucks were 6-speed. The sales share of 7–10-speed transmissions grew to 18% of cars and 22% of light trucks. Continuously variable transmissions (CVTs) were more than one-quarter of the car market and 13.3% of the light truck market.
Market Share of Transmission Speeds, 1980-2016
Supporting Information
| Cars | ||||||
|---|---|---|---|---|---|---|
| Model Year | 3-speed | 4-speed | 5-speed | 6-speed | 7-10-speed | CVT |
| 1980 | 65.6% | 22.0% | 12.4% | 0.0% | 0.0% | 0.0% |
| 1981 | 60.7% | 24.8% | 14.5% | 0.0% | 0.0% | 0.0% |
| 1982 | 54.8% | 29.8% | 15.4% | 0.0% | 0.0% | 0.0% |
| 1983 | 49.8% | 31.0% | 19.2% | 0.0% | 0.0% | 0.0% |
| 1984 | 52.2% | 29.9% | 17.9% | 0.0% | 0.0% | 0.0% |
| 1985 | 46.0% | 35.4% | 18.6% | 0.0% | 0.0% | 0.0% |
| 1986 | 42.8% | 36.9% | 20.3% | 0.0% | 0.0% | 0.0% |
| 1987 | 38.6% | 39.8% | 21.6% | 0.0% | 0.0% | 0.0% |
| 1988 | 36.1% | 44.1% | 19.8% | 0.0% | 0.0% | 0.0% |
| 1989 | 32.4% | 49.5% | 17.9% | 0.0% | 0.0% | 0.1% |
| 1990 | 28.3% | 54.1% | 17.5% | 0.1% | 0.0% | 0.0% |
| 1991 | 24.7% | 56.3% | 18.9% | 0.1% | 0.0% | 0.0% |
| 1992 | 24.6% | 59.0% | 16.3% | 0.1% | 0.0% | 0.0% |
| 1993 | 20.2% | 63.0% | 16.6% | 0.2% | 0.0% | 0.0% |
| 1994 | 13.8% | 69.6% | 16.3% | 0.3% | 0.0% | 0.0% |
| 1995 | 10.1% | 73.3% | 16.2% | 0.4% | 0.0% | 0.0% |
| 1996 | 9.2% | 75.7% | 14.7% | 0.3% | 0.0% | 0.0% |
| 1997 | 7.6% | 76.5% | 15.5% | 0.3% | 0.0% | 0.1% |
| 1998 | 5.5% | 77.3% | 16.8% | 0.3% | 0.0% | 0.1% |
| 1999 | 4.3% | 79.1% | 16.1% | 0.5% | 0.0% | 0.0% |
| 2000 | 5.5% | 75.8% | 17.9% | 0.8% | 0.0% | 0.0% |
| 2001 | 3.4% | 75.1% | 20.2% | 1.2% | 0.0% | 0.2% |
| 2002 | 0.8% | 76.6% | 20.3% | 1.9% | 0.0% | 0.4% |
| 2003 | 0.0% | 67.5% | 27.9% | 3.1% | 0.0% | 1.5% |
| 2004 | 0.0% | 64.5% | 28.4% | 5.0% | 0.4% | 1.7% |
| 2005 | 0.0% | 57.3% | 33.7% | 5.8% | 0.4% | 2.8% |
| 2006 | 0.0% | 47.5% | 35.4% | 12.5% | 1.9% | 2.7% |
| 2007 | 0.0% | 36.8% | 34.7% | 16.5% | 2.3% | 9.7% |
| 2008 | 0.0% | 39.3% | 28.2% | 19.0% | 2.6% | 10.9% |
| 2009 | 0.0% | 35.1% | 31.4% | 19.3% | 3.1% | 11.1% |
| 2010 | 0.0% | 29.5% | 20.2% | 33.0% | 3.4% | 13.9% |
| 2011 | 0.0% | 15.9% | 12.9% | 53.7% | 5.5% | 11.9% |
| 2012 | 0.0% | 6.9% | 14.8% | 57.2% | 6.1% | 15.0% |
| 2013 | 0.0% | 5.8% | 8.6% | 60.0% | 7.5% | 18.0% |
| 2014 | 0.0% | 2.6% | 4.4% | 58.0% | 10.1% | 25.0% |
| 2015 | 0.0% | 1.8% | 1.1% | 52.4% | 14.9% | 29.9% |
| 2016 | 0.0% | 2.8% | 0.8% | 52.7% | 17.5% | 26.3% |
| Light Trucks | ||||||
| Model Year | 3-speed | 4-speed | 5-speed | 6-speed | 7-10-speed | CVT |
| 1980 | 63.9% | 25.3% | 10.8% | 0.0% | 0.0% | 0.0% |
| 1981 | 58.9% | 27.2% | 13.9% | 0.0% | 0.0% | 0.0% |
| 1982 | 50.8% | 33.0% | 16.2% | 0.0% | 0.0% | 0.0% |
| 1983 | 30.8% | 50.8% | 18.4% | 0.0% | 0.0% | 0.0% |
| 1984 | 35.7% | 42.9% | 21.4% | 0.0% | 0.0% | 0.0% |
| 1985 | 37.7% | 40.9% | 21.4% | 0.0% | 0.0% | 0.0% |
| 1986 | 29.5% | 39.6% | 30.9% | 0.0% | 0.0% | 0.0% |
| 1987 | 26.2% | 43.9% | 29.9% | 0.0% | 0.0% | 0.0% |
| 1988 | 22.5% | 45.9% | 31.6% | 0.0% | 0.0% | 0.0% |
| 1989 | 15.4% | 54.9% | 29.7% | 0.0% | 0.0% | 0.0% |
| 1990 | 13.1% | 61.0% | 25.9% | 0.0% | 0.0% | 0.0% |
| 1991 | 7.8% | 61.2% | 31.0% | 0.0% | 0.0% | 0.0% |
| 1992 | 8.5% | 66.1% | 25.4% | 0.0% | 0.0% | 0.0% |
| 1993 | 7.5% | 68.5% | 24.0% | 0.0% | 0.0% | 0.0% |
| 1994 | 5.9% | 70.8% | 23.3% | 0.0% | 0.0% | 0.0% |
| 1995 | 5.2% | 74.4% | 20.4% | 0.0% | 0.0% | 0.0% |
| 1996 | 5.6% | 78.8% | 15.6% | 0.0% | 0.0% | 0.0% |
| 1997 | 4.2% | 75.7% | 20.1% | 0.0% | 0.0% | 0.0% |
| 1998 | 2.4% | 78.7% | 18.9% | 0.0% | 0.0% | 0.0% |
| 1999 | 1.7% | 84.1% | 14.2% | 0.0% | 0.0% | 0.0% |
| 2000 | 1.6% | 85.7% | 12.7% | 0.0% | 0.0% | 0.0% |
| 2001 | 1.0% | 83.0% | 16.0% | 0.0% | 0.0% | 0.0% |
| 2002 | 0.6% | 76.1% | 23.3% | 0.0% | 0.0% | 0.0% |
| 2003 | 0.1% | 71.0% | 28.2% | 0.0% | 0.0% | 0.6% |
| 2004 | 0.0% | 63.2% | 35.5% | 0.8% | 0.0% | 0.6% |
| 2005 | 0.0% | 54.3% | 41.9% | 2.1% | 0.0% | 1.8% |
| 2006 | 0.0% | 48.0% | 44.3% | 3.8% | 0.8% | 3.1% |
| 2007 | 0.0% | 45.8% | 38.0% | 11.5% | 1.0% | 3.6% |
| 2008 | 0.0% | 37.9% | 37.4% | 19.9% | 1.2% | 3.6% |
| 2009 | 0.0% | 23.4% | 33.7% | 35.2% | 1.6% | 6.0% |
| 2010 | 0.0% | 16.4% | 29.1% | 46.7% | 1.9% | 5.9% |
| 2011 | 0.0% | 11.9% | 26.5% | 50.5% | 3.8% | 7.3% |
| 2012 | 0.0% | 10.4% | 24.4% | 54.6% | 4.4% | 6.2% |
| 2013 | 0.0% | 4.7% | 20.2% | 60.3% | 6.0% | 8.8% |
| 2014 | 0.0% | 1.5% | 12.7% | 59.1% | 16.6% | 10.1% |
| 2015 | 0.0% | 1.1% | 9.0% | 56.7% | 17.8% | 15.3% |
| 2016 | 0.0% | 0.6% | 5.0% | 58.9% | 22.3% | 13.3% |
Note: Market share is based on light vehicle production. | ||||||