
SUBSCRIBE to the Fact of the Week
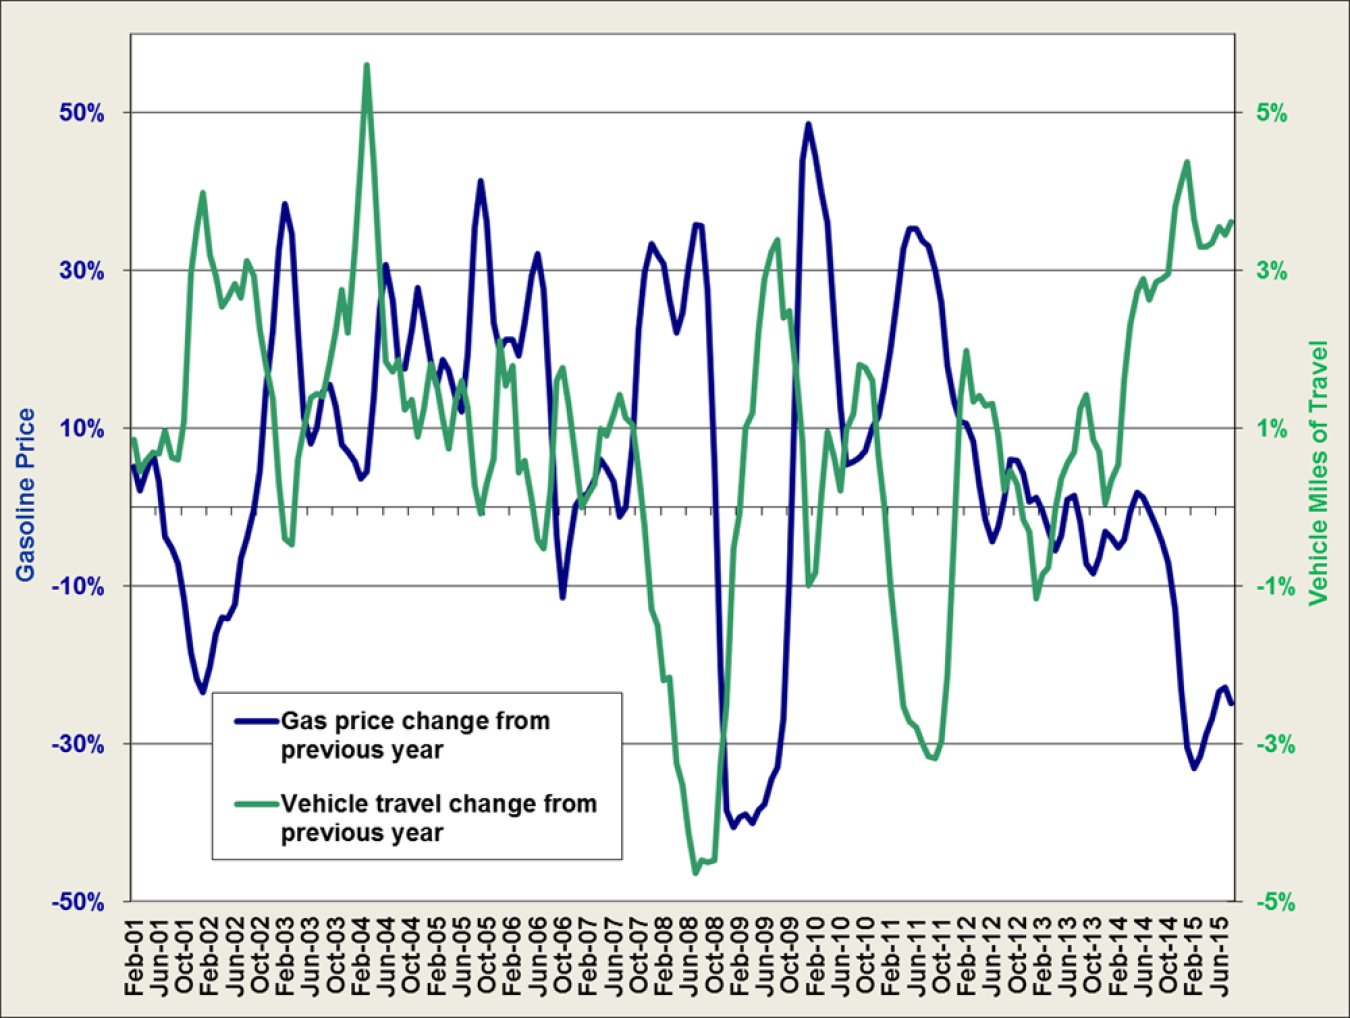
The prices of gasoline and diesel fuel affect the transportation sector in many ways. For example, fuel prices can impact the number of miles driven and affect the choices consumers make when purchasing vehicles. The graph below shows a three-month moving average of the percentage change of monthly data from one year to the next (i.e., February 2001 data were compared with February 2000 data). The change in vehicle travel often mirrors the change in the price of gasoline—when the price of gasoline rises, vehicle travel declines and when the price of gasoline declines, vehicle travel rises. Still, the price of gasoline is just one of the many factors influencing vehicle travel. At the beginning of 2014, the vehicle miles of travel increased even as gasoline prices were increasing.
Changes in VMT and the Price of Gasoline
Supporting Information
| Month-Year | 3-month Moving Average | |
|---|---|---|
| Gas Price Change From Previous Year | Vehicle Travel Change From Previous Year | |
| Feb-01 | 5.1% | 0.9% |
| Mar-01 | 2.1% | 0.4% |
| Apr-01 | 4.4% | 0.6% |
| May-01 | 6.9% | 0.7% |
| Jun-01 | 3.3% | 0.7% |
| Jul-01 | -3.7% | 1.0% |
| Aug-01 | -5.2% | 0.6% |
| Sep-01 | -7.1% | 0.6% |
| Oct-01 | -11.5% | 1.1% |
| Nov-01 | -18.5% | 3.0% |
| Dec-01 | -21.8% | 3.5% |
| Jan-02 | -23.5% | 4.0% |
| Feb-02 | -20.2% | 3.2% |
| Mar-02 | -16.0% | 2.9% |
| Apr-02 | -14.0% | 2.5% |
| May-02 | -14.1% | 2.6% |
| Jun-02 | -12.3% | 2.8% |
| Jul-02 | -6.5% | 2.7% |
| Aug-02 | -4.0% | 3.1% |
| Sep-02 | -0.3% | 2.9% |
| Oct-02 | 4.6% | 2.2% |
| Nov-02 | 14.8% | 1.8% |
| Dec-02 | 22.4% | 1.4% |
| Jan-03 | 32.6% | 0.3% |
| Feb-03 | 38.5% | -0.4% |
| Mar-03 | 34.7% | -0.5% |
| Apr-03 | 22.4% | 0.6% |
| May-03 | 11.4% | 1.0% |
| Jun-03 | 8.1% | 1.4% |
| Jul-03 | 10.1% | 1.4% |
| Aug-03 | 14.6% | 1.4% |
| Sep-03 | 15.5% | 1.8% |
| Oct-03 | 12.7% | 2.2% |
| Nov-03 | 7.9% | 2.7% |
| Dec-03 | 7.1% | 2.2% |
| Jan-04 | 5.7% | 3.3% |
| Feb-04 | 3.7% | 4.4% |
| Mar-04 | 4.5% | 5.6% |
| Apr-04 | 13.9% | 4.4% |
| May-04 | 25.2% | 3.0% |
| Jun-04 | 30.8% | 1.8% |
| Jul-04 | 26.2% | 1.7% |
| Aug-04 | 17.7% | 1.9% |
| Sep-04 | 17.5% | 1.2% |
| Oct-04 | 22.3% | 1.4% |
| Nov-04 | 27.8% | 0.9% |
| Dec-04 | 23.8% | 1.2% |
| Jan-05 | 18.4% | 1.8% |
| Feb-05 | 15.4% | 1.6% |
| Mar-05 | 18.7% | 1.1% |
| Apr-05 | 17.3% | 0.7% |
| May-05 | 13.8% | 1.3% |
| Jun-05 | 12.1% | 1.6% |
| Jul-05 | 19.4% | 1.3% |
| Aug-05 | 35.4% | 0.3% |
| Sep-05 | 41.4% | -0.1% |
| Oct-05 | 36.2% | 0.3% |
| Nov-05 | 23.3% | 0.6% |
| Dec-05 | 19.9% | 2.1% |
| Jan-06 | 21.2% | 1.5% |
| Feb-06 | 21.2% | 1.8% |
| Mar-06 | 19.2% | 0.4% |
| Apr-06 | 23.3% | 0.6% |
| May-06 | 29.3% | 0.1% |
| Jun-06 | 32.2% | -0.4% |
| Jul-06 | 27.6% | -0.5% |
| Aug-06 | 12.4% | 0.2% |
| Sep-06 | -3.6% | 1.6% |
| Oct-06 | -11.4% | 1.8% |
| Nov-06 | -5.3% | 1.3% |
| Dec-06 | 0.2% | 0.6% |
| Jan-07 | 1.3% | 0.0% |
| Feb-07 | 1.7% | 0.1% |
| Mar-07 | 3.5% | 0.3% |
| Apr-07 | 6.0% | 1.0% |
| May-07 | 4.9% | 0.9% |
| Jun-07 | 3.2% | 1.2% |
| Jul-07 | -1.1% | 1.4% |
| Aug-07 | -0.1% | 1.1% |
| Sep-07 | 8.0% | 1.1% |
| Oct-07 | 22.5% | 0.5% |
| Nov-07 | 29.8% | -0.3% |
| Dec-07 | 33.4% | -1.3% |
| Jan-08 | 32.0% | -1.5% |
| Feb-08 | 30.8% | -2.2% |
| Mar-08 | 26.2% | -2.2% |
| Apr-08 | 22.1% | -3.3% |
| May-08 | 24.6% | -3.5% |
| Jun-08 | 30.5% | -4.1% |
| Jul-08 | 35.8% | -4.6% |
| Aug-08 | 35.6% | -4.5% |
| Sep-08 | 27.4% | -4.5% |
| Oct-08 | 5.4% | -4.5% |
| Nov-08 | -20.1% | -3.3% |
| Dec-08 | -38.4% | -2.5% |
| Jan-09 | -40.6% | -0.5% |
| Feb-09 | -39.3% | -0.1% |
| Mar-09 | -39.0% | 1.0% |
| Apr-09 | -40.1% | 1.2% |
| May-09 | -38.5% | 2.2% |
| Jun-09 | -37.6% | 2.9% |
| Jul-09 | -34.6% | 3.2% |
| Aug-09 | -32.9% | 3.4% |
| Sep-09 | -26.8% | 2.4% |
| Oct-09 | -8.7% | 2.5% |
| Nov-09 | 19.9% | 1.7% |
| Dec-09 | 43.9% | 0.8% |
| Jan-10 | 48.6% | -1.0% |
| Feb-10 | 44.5% | -0.8% |
| Mar-10 | 39.9% | 0.2% |
| Apr-10 | 36.1% | 1.0% |
| May-10 | 23.2% | 0.6% |
| Jun-10 | 12.7% | 0.2% |
| Jul-10 | 5.4% | 1.0% |
| Aug-10 | 5.7% | 1.2% |
| Sep-10 | 6.2% | 1.8% |
| Oct-10 | 7.1% | 1.8% |
| Nov-10 | 10.1% | 1.6% |
| Dec-10 | 11.4% | 0.6% |
| Jan-11 | 15.4% | 0.0% |
| Feb-11 | 19.9% | -1.0% |
| Mar-11 | 26.7% | -1.8% |
| Apr-11 | 32.7% | -2.5% |
| May-11 | 35.3% | -2.7% |
| Jun-11 | 35.3% | -2.8% |
| Jul-11 | 33.7% | -3.0% |
| Aug-11 | 33.1% | -3.2% |
| Sep-11 | 30.0% | -3.2% |
| Oct-11 | 25.9% | -3.0% |
| Nov-11 | 18.0% | -2.1% |
| Dec-11 | 13.3% | -0.3% |
| Jan-12 | 10.9% | 1.4% |
| Feb-12 | 10.6% | 2.0% |
| Mar-12 | 8.3% | 1.3% |
| Apr-12 | 2.8% | 1.4% |
| May-12 | -1.6% | 1.3% |
| Jun-12 | -4.4% | 1.3% |
| Jul-12 | -2.5% | 0.9% |
| Aug-12 | 1.1% | 0.2% |
| Sep-12 | 6.0% | 0.5% |
| Oct-12 | 5.9% | 0.3% |
| Nov-12 | 4.2% | -0.2% |
| Dec-12 | 0.7% | -0.3% |
| Jan-13 | 1.2% | -1.2% |
| Feb-13 | -0.5% | -0.9% |
| Mar-13 | -2.9% | -0.8% |
| Apr-13 | -5.5% | 0.0% |
| May-13 | -3.6% | 0.4% |
| Jun-13 | 1.0% | 0.6% |
| Jul-13 | 1.5% | 0.7% |
| Aug-13 | -1.8% | 1.2% |
| Sep-13 | -7.2% | 1.4% |
| Oct-13 | -8.5% | 0.9% |
| Nov-13 | -6.4% | 0.7% |
| Dec-13 | -3.1% | 0.0% |
| Jan-14 | -3.8% | 0.3% |
| Feb-14 | -5.1% | 0.5% |
| Mar-14 | -4.1% | 1.6% |
| Apr-14 | -0.5% | 2.3% |
| May-14 | 1.8% | 2.7% |
| Jun-14 | 1.2% | 2.9% |
| Jul-14 | -0.5% | 2.6% |
| Aug-14 | -2.5% | 2.9% |
| Sep-14 | -4.4% | 2.9% |
| Oct-14 | -7.1% | 3.0% |
| Nov-14 | -12.9% | 3.8% |
| Dec-14 | -23.2% | 4.1% |
| Jan-15 | -30.5% | 4.4% |
| Feb-15 | -33.1% | 3.6% |
| Mar-15 | -31.6% | 3.3% |
| Apr-15 | -28.9% | 3.3% |
| May-15 | -26.8% | 3.4% |
| Jun-15 | -23.4% | 3.5% |
| Jul-15 | -22.8% | 3.5% |
| Aug-15 | -24.9% | 3.6% |
Sources: Federal Highway Administration, September 2015 Traffic Volume Trends, and previous monthly editions. | ||