
SUBSCRIBE to the Fact of the Week
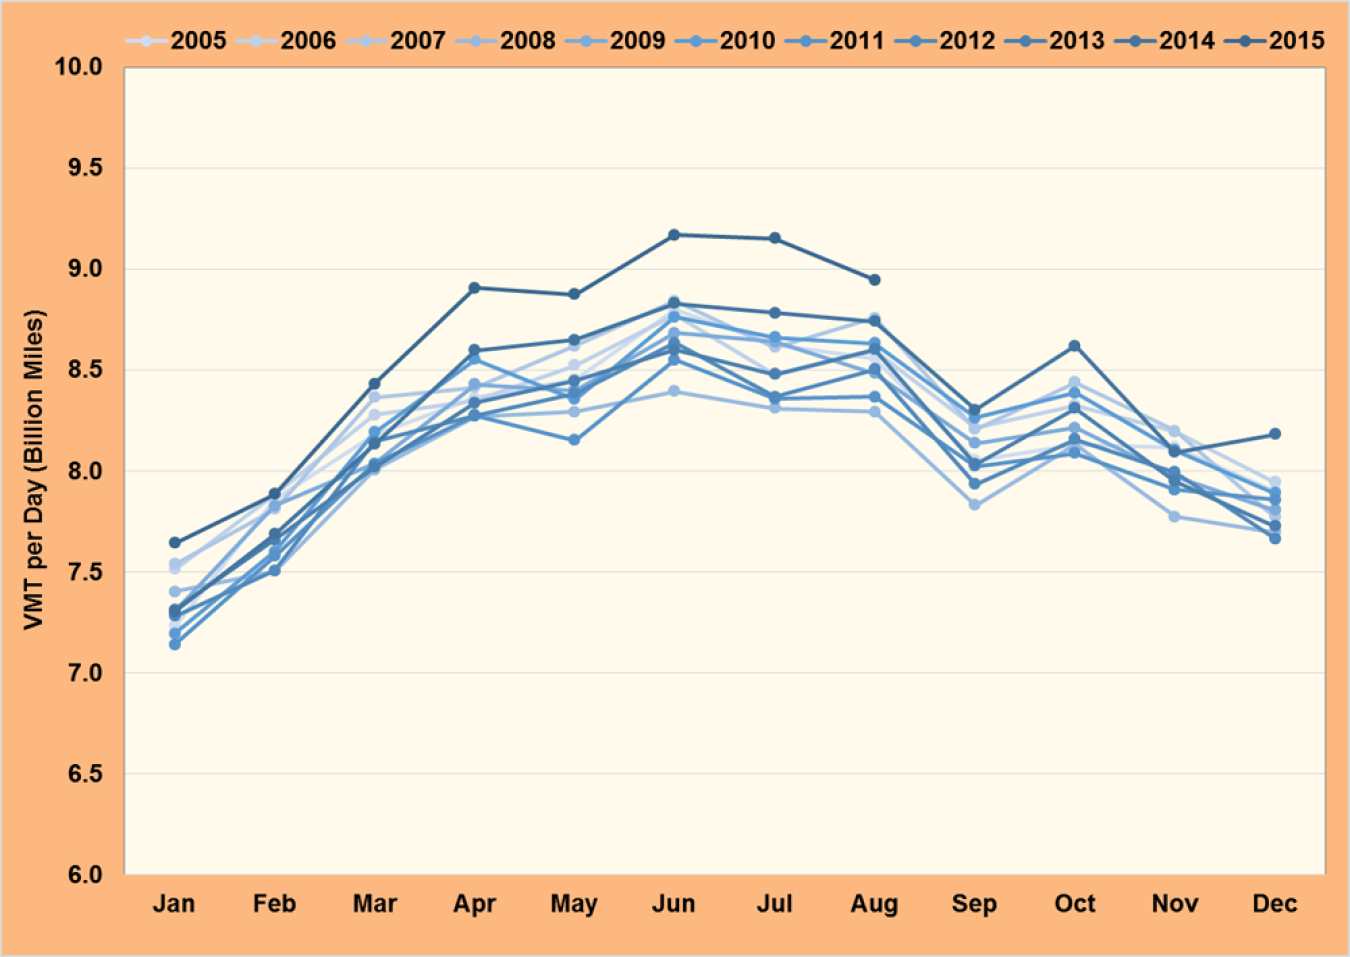
Daily vehicle miles of travel (VMT) have been higher in 2015 than in any of the last ten years. Since April 2015, VMT has averaged 8.9 billion miles per day or more – levels not reached in any month over the last ten years. The cyclical nature of VMT shows that the summer months tend to have the highest vehicle travel and January typically has the lowest daily VMT. A combination of high gas prices and the Great Recession were the likely causes for 2008 VMT being the lowest in the time series.
VMT per Day, January 2005 through August 2015
Supporting Information
| Month | 2005 | 2006 | 2007 | 2008 | 2009 | 2010 | 2011 | 2012 | 2013 | 2014 | 2015 |
|---|---|---|---|---|---|---|---|---|---|---|---|
| Jan | 7.2 | 7.5 | 7.5 | 7.4 | 7.3 | 7.2 | 7.1 | 7.3 | 7.3 | 7.3 | 7.6 |
| Feb | 7.9 | 7.9 | 7.8 | 7.5 | 7.8 | 7.6 | 7.6 | 7.5 | 7.7 | 7.7 | 7.9 |
| Mar | 8.2 | 8.3 | 8.4 | 8.0 | 8.0 | 8.2 | 8.0 | 8.1 | 8.0 | 8.1 | 8.4 |
| Apr | 8.4 | 8.3 | 8.4 | 8.3 | 8.4 | 8.6 | 8.3 | 8.3 | 8.3 | 8.6 | 8.9 |
| May | 8.5 | 8.5 | 8.6 | 8.3 | 8.4 | 8.4 | 8.2 | 8.4 | 8.4 | 8.6 | 8.9 |
| Jun | 8.8 | 8.8 | 8.8 | 8.4 | 8.7 | 8.8 | 8.6 | 8.6 | 8.6 | 8.8 | 9.2 |
| Jul | 8.6 | 8.5 | 8.6 | 8.3 | 8.6 | 8.7 | 8.4 | 8.4 | 8.5 | 8.8 | 9.2 |
| Aug | 8.6 | 8.6 | 8.8 | 8.3 | 8.5 | 8.6 | 8.4 | 8.5 | 8.6 | 8.7 | 8.9 |
| Sep | 8.1 | 8.2 | 8.2 | 7.8 | 8.1 | 8.3 | 8.0 | 7.9 | 8.0 | 8.3 | n/a |
| Oct | 8.1 | 8.3 | 8.4 | 8.1 | 8.2 | 8.4 | 8.1 | 8.2 | 8.3 | 8.6 | n/a |
| Nov | 8.1 | 8.2 | 8.2 | 7.8 | 8.0 | 8.1 | 7.9 | 8.0 | 8.0 | 8.1 | n/a |
| Dec | 7.9 | 7.9 | 7.8 | 7.7 | 7.8 | 7.9 | 7.9 | 7.7 | 7.7 | 8.2 | n/a |
Note: VMT for Sept – Dec 2015 are not yet available. | |||||||||||