
SUBSCRIBE to the Fact of the Week
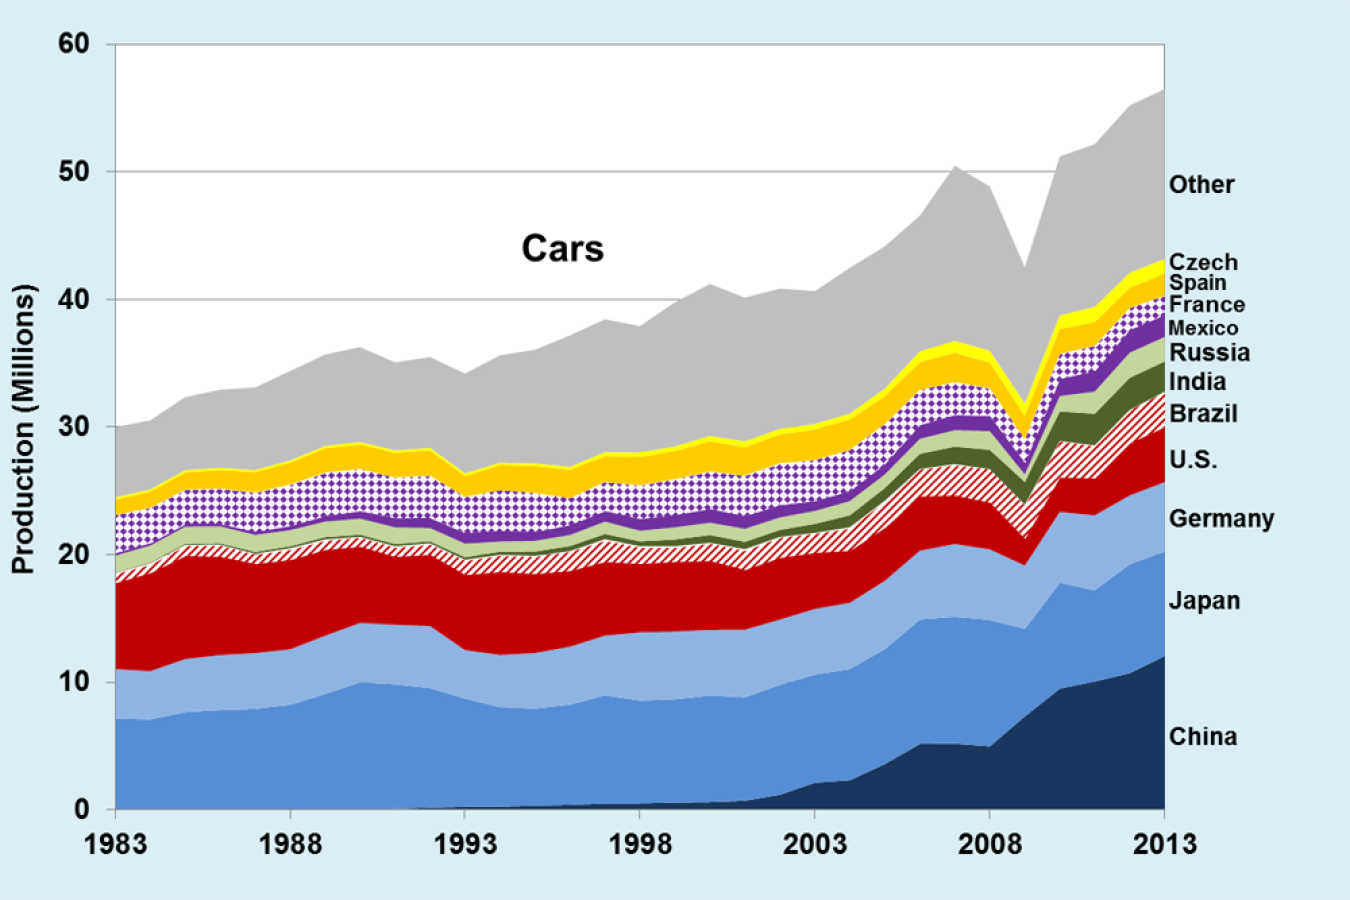
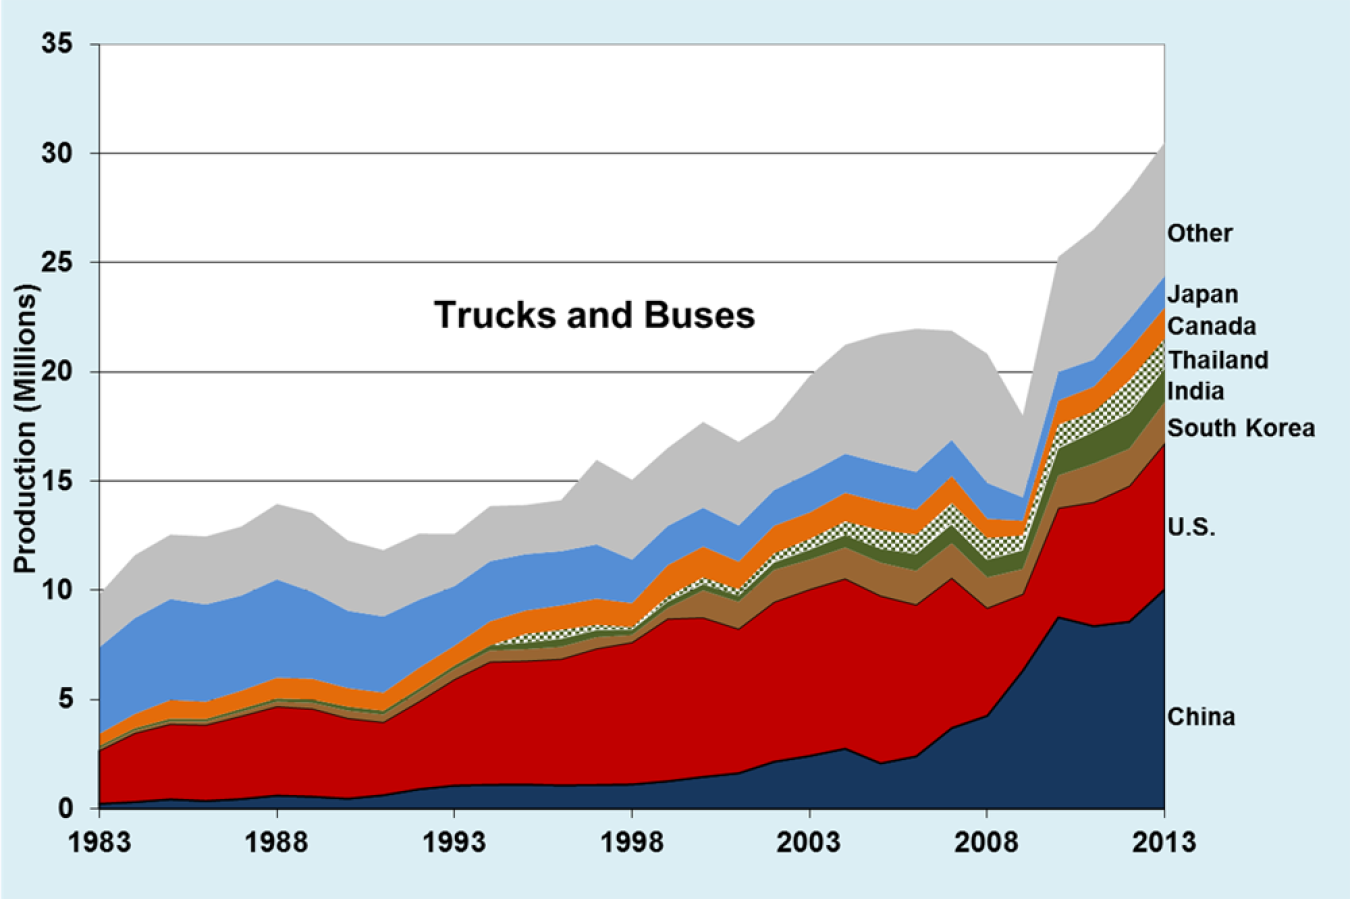
The top countries producing the world’s cars and trucks have changed over the last ten years. In 2013, China was the largest producer of both cars and trucks. In 2000, Japan produced the most cars and the United States produced the most trucks (includes light trucks). The graphs below highlight the top-producing countries for cars and trucks.
World Cars and Trucks Production, 1983–2013
Note:
- Trucks include all trucks and buses. Light trucks, such as pickups, vans, and sport-utility vehicles are included with trucks.
- Note that the two graphs have differing scales for production. Total car production is 56.5 million while total truck and bus production is 30.5 million for 2013.
Supporting Information
| Year | China | Japan | Germany | U.S. | Brazil | India | Russia | Mexico | France | Spain | Czech Republic | Other |
|---|---|---|---|---|---|---|---|---|---|---|---|---|
| 1983 | 6 | 7,152 | 3,878 | 6,782 | 748 | 45 | 1,316 | 207 | 2,961 | 1,225 | 178 | 5,511 |
| 1984 | 6 | 7,073 | 3,790 | 7,773 | 679 | 64 | 1,327 | 245 | 2,713 | 1,255 | 180 | 5,428 |
| 1985 | 5 | 7,647 | 4,167 | 8,186 | 759 | 102 | 1,332 | 268 | 2,632 | 1,345 | 181 | 5,729 |
| 1986 | 12 | 7,810 | 4,311 | 7,829 | 815 | 116 | 1,326 | 191 | 2,773 | 1,439 | 185 | 6,130 |
| 1987 | 21 | 7,891 | 4,374 | 7,100 | 683 | 149 | 1,332 | 266 | 3,052 | 1,594 | 172 | 6,480 |
| 1988 | 36 | 8,198 | 4,346 | 7,137 | 782 | 160 | 1,262 | 354 | 3,224 | 1,722 | 159 | 7,017 |
| 1989 | 29 | 9,052 | 4,564 | 6,821 | 731 | 177 | 1,217 | 439 | 3,409 | 1,897 | 184 | 7,170 |
| 1990 | 42 | 9,948 | 4,661 | 6,078 | 663 | 177 | 1,259 | 598 | 3,295 | 1,916 | 188 | 7,448 |
| 1991 | 81 | 9,753 | 4,677 | 5,440 | 705 | 179 | 1,308 | 720 | 3,188 | 1,943 | 173 | 6,913 |
| 1992 | 163 | 9,379 | 4,864 | 5,667 | 816 | 154 | 1,053 | 776 | 3,329 | 1,972 | 200 | 7,115 |
| 1993 | 230 | 8,494 | 3,794 | 5,982 | 1,100 | 200 | 1,065 | 835 | 2,836 | 1,622 | 220 | 7,819 |
| 1994 | 248 | 7,802 | 4,094 | 6,601 | 1,249 | 237 | 796 | 857 | 3,175 | 1,974 | 174 | 8,432 |
| 1995 | 320 | 7,611 | 4,360 | 6,326 | 1,298 | 330 | 838 | 699 | 3,051 | 2,131 | 193 | 8,913 |
| 1996 | 382 | 7,865 | 4,540 | 6,035 | 1,459 | 396 | 868 | 798 | 2,088 | 2,213 | 240 | 10,313 |
| 1997 | 488 | 8,491 | 4,678 | 5,878 | 1,678 | 410 | 970 | 855 | 2,259 | 2,010 | 321 | 10,415 |
| 1998 | 507 | 8,056 | 5,348 | 5,492 | 1,254 | 384 | 833 | 956 | 2,603 | 2,216 | 369 | 9,907 |
| 1999 | 565 | 8,100 | 5,310 | 5,578 | 1,108 | 533 | 955 | 994 | 2,784 | 2,209 | 349 | 11,308 |
| 2000 | 605 | 8,363 | 5,132 | 5,471 | 1,362 | 605 | 969 | 1,130 | 2,880 | 2,367 | 428 | 11,917 |
| 2001 | 704 | 8,117 | 5,301 | 4,808 | 1,502 | 574 | 1,022 | 1,001 | 3,182 | 2,211 | 457 | 11,271 |
| 2002 | 1,175 | 8,619 | 5,123 | 4,957 | 1,520 | 546 | 980 | 960 | 3,283 | 2,267 | 441 | 10,993 |
| 2003 | 2,124 | 8,478 | 5,145 | 4,453 | 1,505 | 712 | 1,010 | 774 | 3,220 | 2,399 | 436 | 10,401 |
| 2004 | 2,316 | 8,720 | 5,192 | 4,166 | 1,756 | 940 | 1,110 | 782 | 3,227 | 2,403 | 443 | 11,434 |
| 2005 | 3,586 | 9,017 | 5,350 | 4,266 | 2,009 | 999 | 1,068 | 846 | 3,113 | 2,174 | 599 | 11,146 |
| 2006 | 5,161 | 9,757 | 5,399 | 4,312 | 2,092 | 1,186 | 1,176 | 1,098 | 2,728 | 2,187 | 849 | 10,632 |
| 2007 | 5,185 | 9,945 | 5,709 | 3,867 | 2,388 | 1,377 | 1,293 | 1,209 | 2,551 | 2,309 | 926 | 13,732 |
| 2008 | 4,971 | 9,916 | 5,532 | 3,731 | 2,561 | 1,507 | 1,470 | 1,217 | 2,145 | 2,014 | 933 | 12,874 |
| 2009 | 7,322 | 6,862 | 4,965 | 2,196 | 2,578 | 1,781 | 596 | 943 | 1,815 | 1,827 | 968 | 10,672 |
| 2010 | 9,494 | 8,307 | 5,552 | 2,732 | 2,828 | 2,317 | 1,208 | 1,386 | 1,914 | 1,951 | 1,070 | 12,470 |
| 2011 | 10,053 | 7,159 | 5,872 | 2,978 | 2,505 | 2,479 | 1,738 | 1,657 | 1,931 | 1,868 | 1,192 | 12,747 |
| 2012 | 10,705 | 8,554 | 5,388 | 4,109 | 2,591 | 2,520 | 1,969 | 1,810 | 1,683 | 1,595 | 1,172 | 13,129 |
| 2013 | 12,059 | 8,189 | 5,440 | 4,369 | 2,723 | 2,370 | 1,920 | 1,772 | 1,461 | 1,755 | 1,127 | 13,324 |
Source: Oak Ridge National Laboratory, Transportation Energy Data Book: Edition 34, Figure 3.1, September 2015. | ||||||||||||
| Year | China | U.S. | South Korea | India | Thailand | Canada | Japan | Other |
|---|---|---|---|---|---|---|---|---|
| 1983 | 234 | 2,444 | 99 | 109 | 554 | 3,960 | 2,423 | |
| 1984 | 311 | 3,166 | 107 | 116 | 649 | 4,392 | 2,875 | |
| 1985 | 438 | 3,452 | 114 | 128 | 855 | 4,625 | 2,944 | |
| 1986 | 361 | 3,491 | 144 | 123 | 791 | 4,450 | 3,113 | |
| 1987 | 451 | 3,812 | 186 | 140 | 826 | 4,358 | 3,154 | |
| 1988 | 610 | 4,085 | 212 | 152 | 949 | 4,501 | 3,454 | |
| 1989 | 558 | 4,036 | 257 | 160 | 947 | 3,973 | 3,618 | |
| 1990 | 467 | 3,690 | 335 | 187 | 850 | 3,539 | 3,213 | |
| 1991 | 627 | 3,350 | 340 | 176 | 828 | 3,492 | 3,035 | |
| 1992 | 899 | 4,025 | 423 | 166 | 945 | 3,121 | 3,021 | |
| 1993 | 1,067 | 4,873 | 458 | 173 | 900 | 2,734 | 2,383 | |
| 1994 | 1,103 | 5,638 | 506 | 237 | 1,106 | 2,752 | 2,520 | |
| 1995 | 1,114 | 5,669 | 524 | 306 | 397 | 1,071 | 2,585 | 2,247 |
| 1996 | 1,074 | 5,795 | 548 | 366 | 418 | 1,117 | 2,482 | 2,335 |
| 1997 | 1,095 | 6,252 | 510 | 326 | 247 | 1,198 | 2,483 | 3,870 |
| 1998 | 1,121 | 6,510 | 330 | 244 | 125 | 1,089 | 1,994 | 3,649 |
| 1999 | 1,265 | 7,447 | 481 | 285 | 249 | 1,431 | 1,795 | 3,565 |
| 2000 | 1,464 | 7,303 | 1,233 | 284 | 315 | 1,413 | 1,781 | 3,924 |
| 2001 | 1,631 | 6,617 | 1,231 | 276 | 303 | 1,260 | 1,660 | 3,825 |
| 2002 | 2,160 | 7,322 | 1,456 | 347 | 415 | 1,264 | 1,638 | 3,240 |
| 2003 | 2,424 | 7,634 | 1,353 | 450 | 499 | 1,213 | 1,808 | 4,444 |
| 2004 | 2,755 | 7,794 | 1,415 | 571 | 628 | 1,311 | 1,791 | 4,982 |
| 2005 | 2,082 | 7,681 | 1,505 | 643 | 848 | 1,281 | 1,783 | 5,913 |
| 2006 | 2,406 | 6,949 | 1,542 | 772 | 889 | 1,144 | 1,728 | 6,554 |
| 2007 | 3,700 | 6,885 | 1,577 | 872 | 972 | 1,237 | 1,652 | 4,998 |
| 2008 | 4,262 | 4,941 | 1,391 | 809 | 992 | 887 | 1,647 | 5,910 |
| 2009 | 6,326 | 3,514 | 1,138 | 861 | 686 | 669 | 1,072 | 3,747 |
| 2010 | 8,770 | 5,012 | 1,480 | 1,237 | 1,091 | 1,101 | 1,318 | 5,267 |
| 2011 | 8,366 | 5,685 | 1,755 | 1,461 | 920 | 1,145 | 1,240 | 5,961 |
| 2012 | 8,567 | 6,227 | 1,690 | 1,628 | 1,496 | 1,423 | 1,388 | 5,915 |
| 2013 | 10,058 | 6,698 | 1,883 | 1,526 | 1,386 | 1,415 | 1,441 | 6,123 |
Source: Oak Ridge National Laboratory, Transportation Energy Data Book: Edition 34, Figure 3.2, September 2015. | ||||||||