
SUBSCRIBE to the Fact of the Week
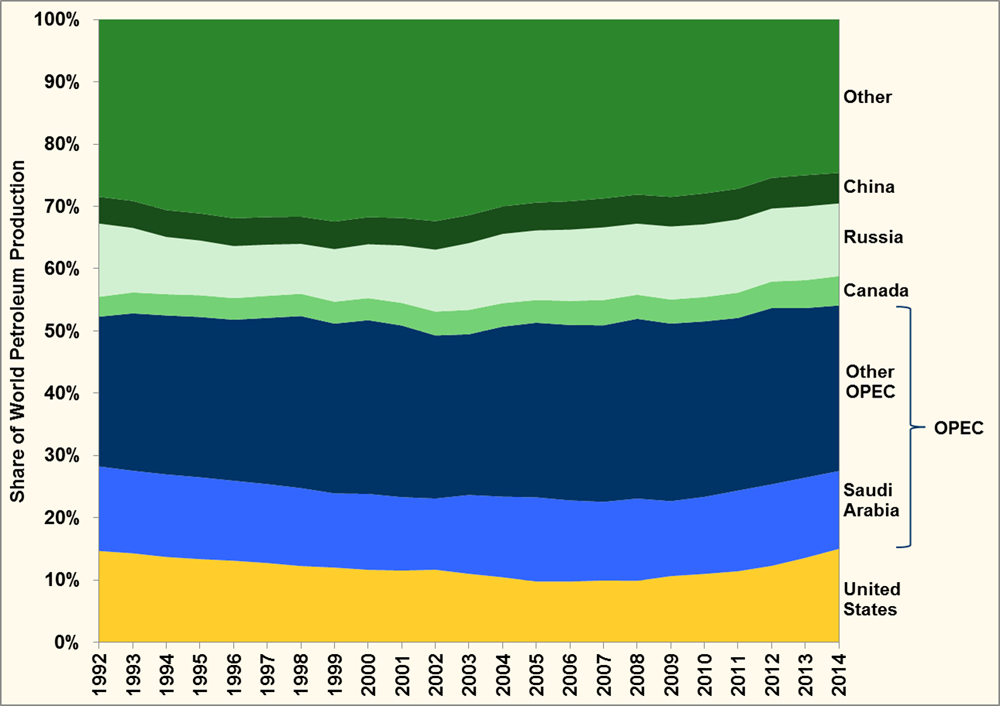
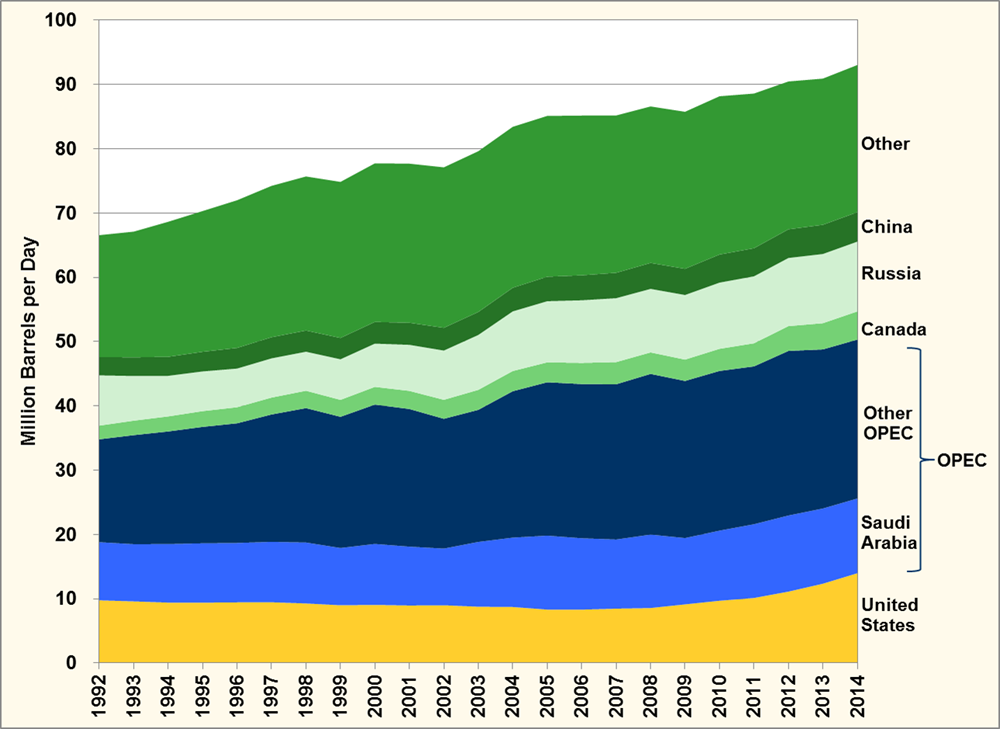
Although the United States has increased the production of petroleum in recent years, it accounted for only 15% of the World’s production in 2014 – the same percentage as in 1992. The total amount of petroleum produced world-wide grew from 66.6 million barrels per day (mmbd) in 1992 to 93.0 mmbd in 2014. However, the production shares by country have changed little over the same time period. OPEC accounted for 38% of production in 1992 and 39% in 2014.
Share of World Petroleum Production, 1992-2014
World Petroleum Production, 1992-2014
Notes:
Includes crude oil, natural gas plant liquids, other liquids, and processing gain.
OPEC = Organization for Petroleum Exporting Countries. The OPEC countries are Algeria, Angola, Ecuador, Iran, Iraq, Kuwait, Libya, Nigeria, Qatar, Saudi Arabia, United Arab Emirates, and Venezuela.
Supporting Information
| Year | United States | OPEC | Canada | Russia | China | Other | World Petroleum Production (Million barrels per day) | |
|---|---|---|---|---|---|---|---|---|
| Saudi Arabia | Other OPEC | |||||||
| 1992 | 15% | 14% | 24% | 3% | 12% | 4% | 28% | 66.6 |
| 1993 | 14% | 13% | 25% | 3% | 10% | 4% | 29% | 67.1 |
| 1994 | 14% | 13% | 26% | 3% | 9% | 4% | 31% | 68.6 |
| 1995 | 13% | 13% | 26% | 3% | 9% | 4% | 31% | 70.3 |
| 1996 | 13% | 13% | 26% | 3% | 8% | 4% | 32% | 72.0 |
| 1997 | 13% | 13% | 27% | 4% | 8% | 4% | 32% | 74.2 |
| 1998 | 12% | 13% | 28% | 4% | 8% | 4% | 32% | 75.7 |
| 1999 | 12% | 12% | 27% | 4% | 8% | 4% | 32% | 74.8 |
| 2000 | 12% | 12% | 28% | 4% | 9% | 4% | 32% | 77.7 |
| 2001 | 12% | 12% | 28% | 4% | 9% | 4% | 32% | 77.7 |
| 2002 | 12% | 11% | 26% | 4% | 10% | 5% | 32% | 77.1 |
| 2003 | 11% | 13% | 26% | 4% | 11% | 4% | 31% | 79.6 |
| 2004 | 10% | 13% | 27% | 4% | 11% | 4% | 30% | 83.4 |
| 2005 | 10% | 14% | 28% | 4% | 11% | 4% | 29% | 85.1 |
| 2006 | 10% | 13% | 28% | 4% | 11% | 5% | 29% | 85.2 |
| 2007 | 10% | 13% | 28% | 4% | 12% | 5% | 29% | 85.2 |
| 2008 | 10% | 13% | 29% | 4% | 11% | 5% | 28% | 86.6 |
| 2009 | 11% | 12% | 29% | 4% | 12% | 5% | 28% | 85.7 |
| 2010 | 11% | 12% | 28% | 4% | 12% | 5% | 28% | 88.2 |
| 2011 | 11% | 13% | 28% | 4% | 12% | 5% | 27% | 88.6 |
| 2012 | 12% | 13% | 28% | 4% | 12% | 5% | 25% | 90.5 |
| 2013 | 14% | 13% | 27% | 4% | 12% | 5% | 25% | 90.9 |
| 2014 | 15% | 12% | 27% | 5% | 12% | 5% | 25% | 93.0 |
| Source: Source: U.S. Department of Energy, Energy Information Administration, International Energy Statistics, accessed July 28, 2015. | ||||||||
| Year | United States | OPEC | Canada | Russia | China | Other | World | |
|---|---|---|---|---|---|---|---|---|
| Saudi Arabia | Other OPEC | |||||||
| 1992 | 9.8 | 9.0 | 16.0 | 2.1 | 7.8 | 2.9 | 18.9 | 66.6 |
| 1993 | 9.6 | 8.9 | 17.0 | 2.3 | 7.0 | 2.9 | 19.5 | 67.1 |
| 1994 | 9.4 | 9.1 | 17.5 | 2.3 | 6.3 | 3.0 | 21.0 | 68.6 |
| 1995 | 9.4 | 9.2 | 18.1 | 2.5 | 6.2 | 3.1 | 21.9 | 70.3 |
| 1996 | 9.4 | 9.2 | 18.6 | 2.5 | 6.0 | 3.2 | 23.0 | 72.0 |
| 1997 | 9.5 | 9.4 | 19.8 | 2.6 | 6.1 | 3.3 | 23.5 | 74.2 |
| 1998 | 9.3 | 9.5 | 20.9 | 2.7 | 6.1 | 3.3 | 24.0 | 75.7 |
| 1999 | 9.0 | 8.9 | 20.4 | 2.6 | 6.3 | 3.3 | 24.3 | 74.8 |
| 2000 | 9.1 | 9.5 | 21.7 | 2.8 | 6.7 | 3.4 | 24.7 | 77.7 |
| 2001 | 9.0 | 9.2 | 21.4 | 2.8 | 7.2 | 3.4 | 24.7 | 77.7 |
| 2002 | 9.0 | 8.8 | 20.2 | 3.0 | 7.7 | 3.5 | 25.0 | 77.1 |
| 2003 | 8.8 | 10.1 | 20.5 | 3.1 | 8.5 | 3.6 | 25.0 | 79.6 |
| 2004 | 8.7 | 10.8 | 22.8 | 3.1 | 9.3 | 3.7 | 25.0 | 83.4 |
| 2005 | 8.3 | 11.5 | 23.9 | 3.1 | 9.5 | 3.8 | 25.0 | 85.1 |
| 2006 | 8.3 | 11.1 | 24.0 | 3.3 | 9.7 | 3.9 | 24.8 | 85.2 |
| 2007 | 8.5 | 10.7 | 24.1 | 3.4 | 9.9 | 4.0 | 24.5 | 85.2 |
| 2008 | 8.6 | 11.4 | 25.0 | 3.3 | 9.9 | 4.0 | 24.3 | 86.6 |
| 2009 | 9.1 | 10.3 | 24.4 | 3.3 | 10.0 | 4.1 | 24.4 | 85.7 |
| 2010 | 9.7 | 10.9 | 24.8 | 3.4 | 10.3 | 4.4 | 24.6 | 88.2 |
| 2011 | 10.1 | 11.5 | 24.5 | 3.6 | 10.4 | 4.4 | 24.1 | 88.6 |
| 2012 | 11.1 | 11.8 | 25.6 | 3.9 | 10.6 | 4.5 | 23.0 | 90.5 |
| 2013 | 12.3 | 11.7 | 24.7 | 4.1 | 10.8 | 4.5 | 22.7 | 90.9 |
| 2014 | 14.0 | 11.6 | 24.7 | 4.4 | 10.9 | 4.6 | 22.9 | 93.0 |
| Source: U.S. Department of Energy, Energy Information Administration, International Energy Statistics, accessed July 28, 2015. | ||||||||
Return to 2015 Facts of the Week