
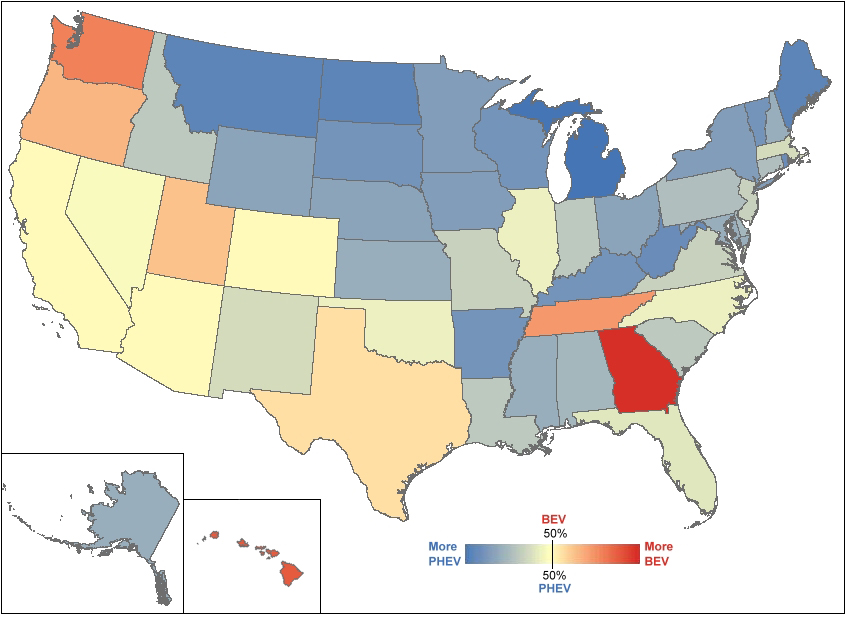
Plug-in electric vehicles (PEVs) include both battery electric vehicles (BEVs) which run only on electricity, and plug-in hybrid electric vehicles (PHEVs) which run on electricity and/or gasoline. Considering all PEVs within a state in 2014, the map below shows states with a greater share of BEVs in red and states with a greater share of PHEVs in blue. Those states where the BEVs and PHEVs are near 50/50 are a neutral color. Georgia had by far the highest percentage of BEVs (84%) of total PEVs. Generous state incentives for purchasing a BEV in Georgia likely account for this high percentage. Hawaii had the next highest share, followed by Washington, Tennessee, Oregon, Utah, and Texas – all with more than 50% BEVs of all plug-ins registered in the State. States such as Michigan, Montana, North Dakota, Wyoming, and Maine had higher shares of PHEV registrations. For these states and a number of others, PHEVs, which can run on gasoline if necessary, are the most common type of PEV.
Share of BEVs and PHEVs by State, 2014
Notes:
PEV – Plug-in electric vehicle (includes BEV and PHEV)
BEV – Battery electric vehicle (also referred to as an all-electric vehicle)
PHEV – Plug-in hybrid electric vehicle (has a gasoline engine as a backup for when the battery is depleted.)
PEV and BEV registrations include all PEVs and BEVs under 10,000 lbs. gross vehicle weight registered in the state in July 2014.
Supporting Information
| All PEVs | ||
|---|---|---|
| State | BEV Share | PHEV Share |
| Alabama | 32% | 68% |
| Alaska | 28% | 72% |
| Arizona | 49% | 51% |
| Arkansas | 21% | 79% |
| California | 49% | 51% |
| Colorado | 48% | 52% |
| Connecticut | 33% | 67% |
| Delaware | 31% | 69% |
| District of Columbia | 38% | 62% |
| Florida | 43% | 57% |
| Georgia | 84% | 16% |
| Hawaii | 76% | 24% |
| Idaho | 35% | 65% |
| Illinois | 44% | 56% |
| Indiana | 35% | 65% |
| Iowa | 24% | 76% |
| Kansas | 29% | 71% |
| Kentucky | 23% | 77% |
| Louisiana | 36% | 64% |
| Maine | 18% | 82% |
| Maryland | 29% | 71% |
| Massachusetts | 39% | 61% |
| Michigan | 12% | 88% |
| Minnesota | 23% | 77% |
| Mississippi | 29% | 71% |
| Missouri | 38% | 62% |
| Montana | 18% | 82% |
| Nebraska | 27% | 73% |
| Nevada | 47% | 53% |
| New Hampshire | 30% | 70% |
| New Jersey | 38% | 62% |
| New Mexico | 41% | 59% |
| New York | 25% | 75% |
| North Carolina | 45% | 55% |
| North Dakota | 18% | 82% |
| Ohio | 27% | 73% |
| Oklahoma | 45% | 55% |
| Oregon | 60% | 40% |
| Pennsylvania | 33% | 67% |
| Rhode Island | 20% | 80% |
| South Carolina | 37% | 63% |
| South Dakota | 23% | 78% |
| Tennessee | 66% | 34% |
| Texas | 53% | 47% |
| Utah | 58% | 42% |
| Vermont | 23% | 77% |
| Virginia | 37% | 63% |
| Washington | 70% | 30% |
| West Virginia | 19% | 81% |
| Wisconsin | 23% | 77% |
| Wyoming | 27% | 73% |
| All | 47% | 53% |
Source: National Renewable Energy Laboratory analysis, R.L. Polk, POLK_VIO_DETAIL_2014, May 2015. | ||