
Hybrid electric vehicles (HEVs) are conventional hybrid vehicles that use a gasoline engine with a hybrid electric drive for superior efficiency; they do not plug-in. This type of hybrid vehicle was introduced to the U.S. market in 1999 with the Honda Insight and followed by the Toyota Prius in 2000. After about 15 years of sales, HEVs have been adopted at varying rates across the United States. California has the highest concentration of HEV registrations with 20.1 HEVs per thousand people. In general, the West Coast and Northeast have the highest concentrations of HEVs per thousand people. Mississippi, Louisiana, North Dakota, and West Virginia have the lowest number of HEV registrations relative to their population with less than 5 per thousand people.
Hybrid Electric Light Vehicle Registrations per Thousand People by State, 2014
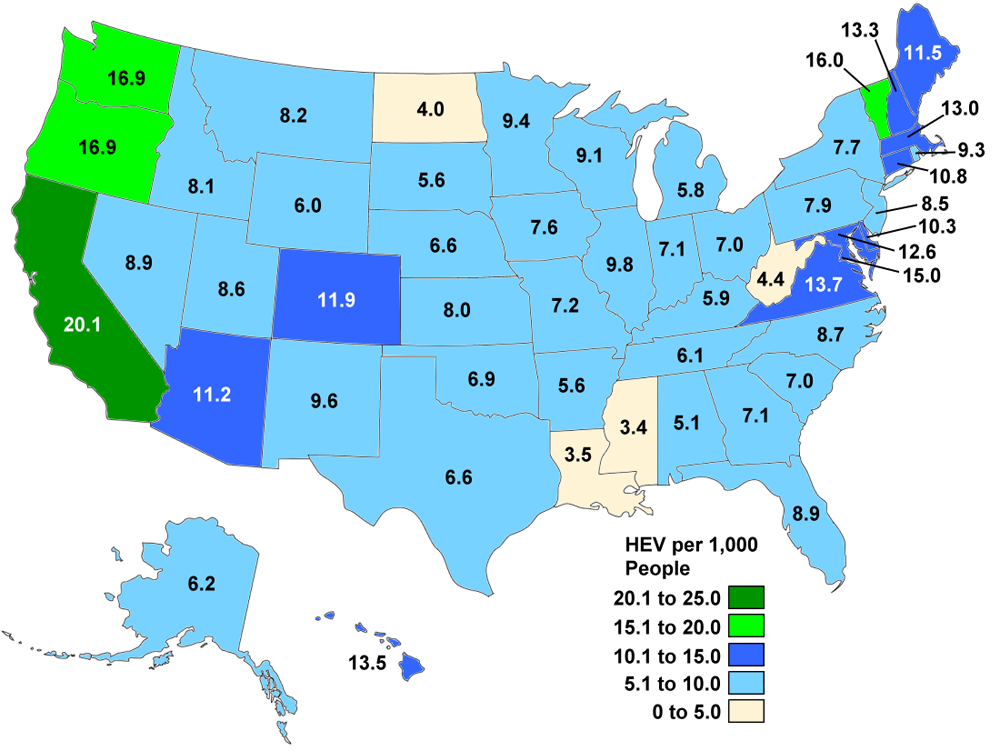
Note: HEV registrations include all HEVs under 10,000 lbs. gross vehicle weight registered in the state in July 2014.
Supporting Information
| State | HEV Registrations | Population Estimates | HEV Registrations per Thousand People |
|---|---|---|---|
| Alabama | 24,955 | 4,849,377 | 5.1 |
| Alabama | 24,955 | 4,849,377 | 5.1 |
| Alaska | 4,534 | 736,732 | 6.2 |
| Arizona | 75,452 | 6,731,484 | 11.2 |
| Arkansas | 16,750 | 2,966,369 | 5.6 |
| California | 778,405 | 38,802,500 | 20.1 |
| Colorado | 63,597 | 5,355,866 | 11.9 |
| Connecticut | 39,001 | 3,596,677 | 10.8 |
| Delaware | 9,601 | 935,614 | 10.3 |
| District of Columbia | 9,915 | 658,893 | 15.0 |
| Florida | 177,622 | 19,893,297 | 8.9 |
| Georgia | 71,786 | 10,097,343 | 7.1 |
| Hawaii | 19,120 | 1,419,561 | 13.5 |
| Idaho | 13,310 | 1,634,464 | 8.1 |
| Illinois | 125,714 | 12,880,580 | 9.8 |
| Indiana | 46,575 | 6,596,855 | 7.1 |
| Iowa | 23,489 | 3,107,126 | 7.6 |
| Kansas | 23,113 | 2,904,021 | 8.0 |
| Kentucky | 26,060 | 4,413,457 | 5.9 |
| Louisiana | 16,248 | 4,649,676 | 3.5 |
| Maine | 15,303 | 1,330,089 | 11.5 |
| Maryland | 75,050 | 5,976,407 | 12.6 |
| Massachusetts | 87,952 | 6,745,408 | 13.0 |
| Michigan | 57,053 | 9,909,877 | 5.8 |
| Minnesota | 51,515 | 5,457,173 | 9.4 |
| Mississippi | 10,250 | 2,994,079 | 3.4 |
| Missouri | 43,692 | 6,063,589 | 7.2 |
| Montana | 8,376 | 1,023,579 | 8.2 |
| Nebraska | 12,386 | 1,881,503 | 6.6 |
| Nevada | 25,321 | 2,839,099 | 8.9 |
| New Hampshire | 17,633 | 1,326,813 | 13.3 |
| New Jersey | 75,911 | 8,938,175 | 8.5 |
| New Mexico | 20,026 | 2,085,572 | 9.6 |
| New York | 151,095 | 19,746,227 | 7.7 |
| North Carolina | 86,734 | 9,943,964 | 8.7 |
| North Dakota | 2,964 | 739,482 | 4.0 |
| Ohio | 80,594 | 11,594,163 | 7.0 |
| Oklahoma | 26,642 | 3,878,051 | 6.9 |
| Oregon | 67,180 | 3,970,239 | 16.9 |
| Pennsylvania | 100,914 | 12,787,209 | 7.9 |
| Rhode Island | 9,837 | 1,055,173 | 9.3 |
| South Carolina | 33,835 | 4,832,482 | 7.0 |
| South Dakota | 4,790 | 853,175 | 5.6 |
| Tennessee | 40,082 | 6,549,352 | 6.1 |
| Texas | 177,585 | 26,956,958 | 6.6 |
| Utah | 25,232 | 2,942,902 | 8.6 |
| Vermont | 10,028 | 626,562 | 16.0 |
| Virginia | 113,924 | 8,326,289 | 13.7 |
| Washington | 119,534 | 7,061,530 | 16.9 |
| West Virginia | 8,165 | 1,850,326 | 4.4 |
| Wisconsin | 52,544 | 5,757,564 | 9.1 |
| Wyoming | 3,498 | 584,153 | 6.0 |
| All | 3,180,892 | 318,857,056 | 10.0 |
| Wyoming | 3,498 | 584,153 | 6.0 |
| All | 3,180,892 | 318,857,056 | 10.0 |
|
Source: HEV registrations - National Renewable Energy Laboratory analysis, R.L. Polk, POLK_VIO_DETAIL_2014, May 2015. |