
In 1975, cars were just over 80% of light vehicle production. From the early 1980s to 2005, light trucks were an increasing share of the light vehicles produced. The share of sport utility vehicles (SUVs) has grown from about 6% of production in 1990 to one-third of the production in 2014 (counting both car SUVs and truck SUVs). The share of vans and pickups has generally declined since the mid-1990s.
Shares of Light Vehicle Production by Type, 1975-2014
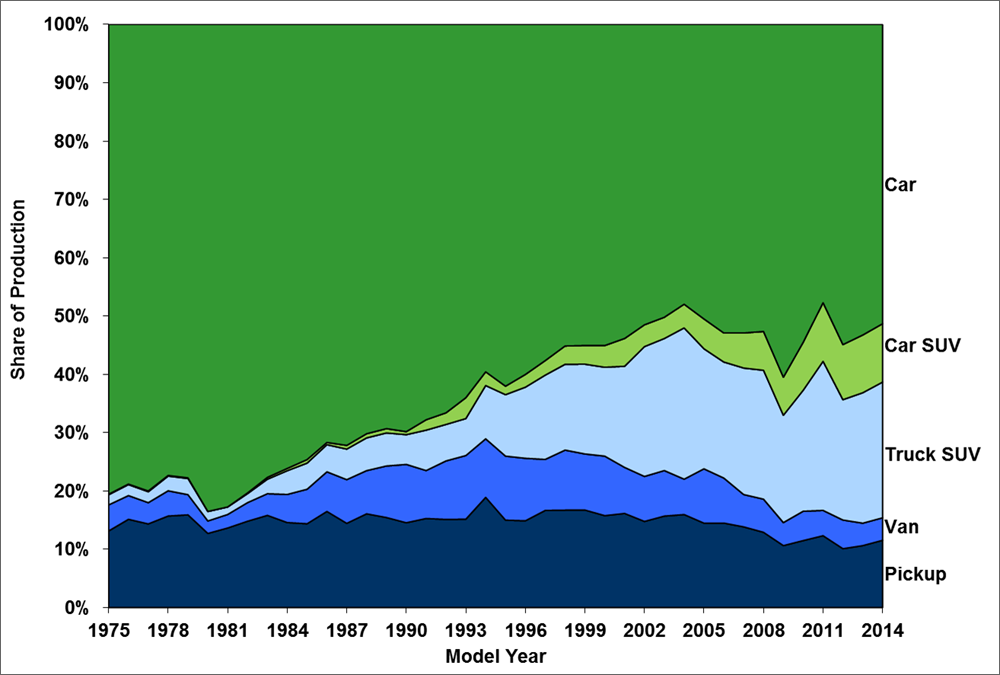
Note: Car SUVs are those SUVs that must meet the car greenhouse gas emissions and corporate average fuel economy (CAFE) standards that were set in 2012 (Federal Register, Vol. 77, No. 199, Monday, October 15, 2012). Generally, they are two-wheel drive SUVs with a gross vehicle weight rating less than 6,000 lbs.
Supporting Information
| Model Year | Car | Car SUV | Pickup | Van | Truck SUV |
|---|---|---|---|---|---|
| 1975 | 80.6% | 0.1% | 13.1% | 4.5% | 1.7% |
| 1976 | 78.8% | 0.1% | 15.1% | 4.1% | 1.9% |
| 1977 | 80.0% | 0.1% | 14.3% | 3.6% | 1.9% |
| 1978 | 77.3% | 0.1% | 15.7% | 4.3% | 2.5% |
| 1979 | 77.8% | 0.1% | 15.9% | 3.5% | 2.8% |
| 1980 | 83.5% | 0.0% | 12.7% | 2.1% | 1.6% |
| 1981 | 82.7% | 0.0% | 13.6% | 2.3% | 1.3% |
| 1982 | 80.3% | 0.1% | 14.8% | 3.2% | 1.5% |
| 1983 | 77.7% | 0.3% | 15.8% | 3.7% | 2.5% |
| 1984 | 76.1% | 0.4% | 14.6% | 4.8% | 4.1% |
| 1985 | 74.6% | 0.6% | 14.4% | 5.9% | 4.5% |
| 1986 | 71.7% | 0.4% | 16.5% | 6.8% | 4.6% |
| 1987 | 72.2% | 0.6% | 14.4% | 7.5% | 5.2% |
| 1988 | 70.2% | 0.7% | 16.1% | 7.4% | 5.6% |
| 1989 | 69.3% | 0.7% | 15.4% | 8.8% | 5.7% |
| 1990 | 69.8% | 0.5% | 14.5% | 10.0% | 5.1% |
| 1991 | 67.8% | 1.8% | 15.3% | 8.2% | 6.9% |
| 1992 | 66.6% | 2.0% | 15.1% | 10.0% | 6.2% |
| 1993 | 64.0% | 3.6% | 15.2% | 10.9% | 6.3% |
| 1994 | 59.6% | 2.3% | 18.9% | 10.0% | 9.1% |
| 1995 | 62.0% | 1.5% | 15.0% | 11.0% | 10.5% |
| 1996 | 60.0% | 2.2% | 14.9% | 10.7% | 12.2% |
| 1997 | 57.6% | 2.5% | 16.7% | 8.8% | 14.5% |
| 1998 | 55.1% | 3.1% | 16.7% | 10.3% | 14.7% |
| 1999 | 55.1% | 3.2% | 16.7% | 9.6% | 15.4% |
| 2000 | 55.1% | 3.7% | 15.8% | 10.2% | 15.2% |
| 2001 | 53.9% | 4.8% | 16.1% | 7.9% | 17.3% |
| 2002 | 51.5% | 3.7% | 14.8% | 7.7% | 22.3% |
| 2003 | 50.2% | 3.6% | 15.7% | 7.8% | 22.6% |
| 2004 | 48.0% | 4.1% | 15.9% | 6.1% | 25.9% |
| 2005 | 50.5% | 5.1% | 14.5% | 9.3% | 20.6% |
| 2006 | 52.9% | 5.0% | 14.5% | 7.7% | 19.9% |
| 2007 | 52.9% | 6.0% | 13.8% | 5.5% | 21.7% |
| 2008 | 52.7% | 6.6% | 12.9% | 5.7% | 22.1% |
| 2009 | 60.5% | 6.5% | 10.6% | 4.0% | 18.4% |
| 2010 | 54.5% | 8.2% | 11.5% | 5.0% | 20.8% |
| 2011 | 47.7% | 10.1% | 12.3% | 4.3% | 25.6% |
| 2012 | 54.9% | 9.4% | 10.1% | 4.9% | 20.6% |
| 2013 | 53.3% | 9.9% | 10.6% | 3.8% | 22.4% |
| 2014 | 51.3% | 10.0% | 11.5% | 3.9% | 23.3% |
Note: 2014 estimates are based on preliminary production data. | |||||