
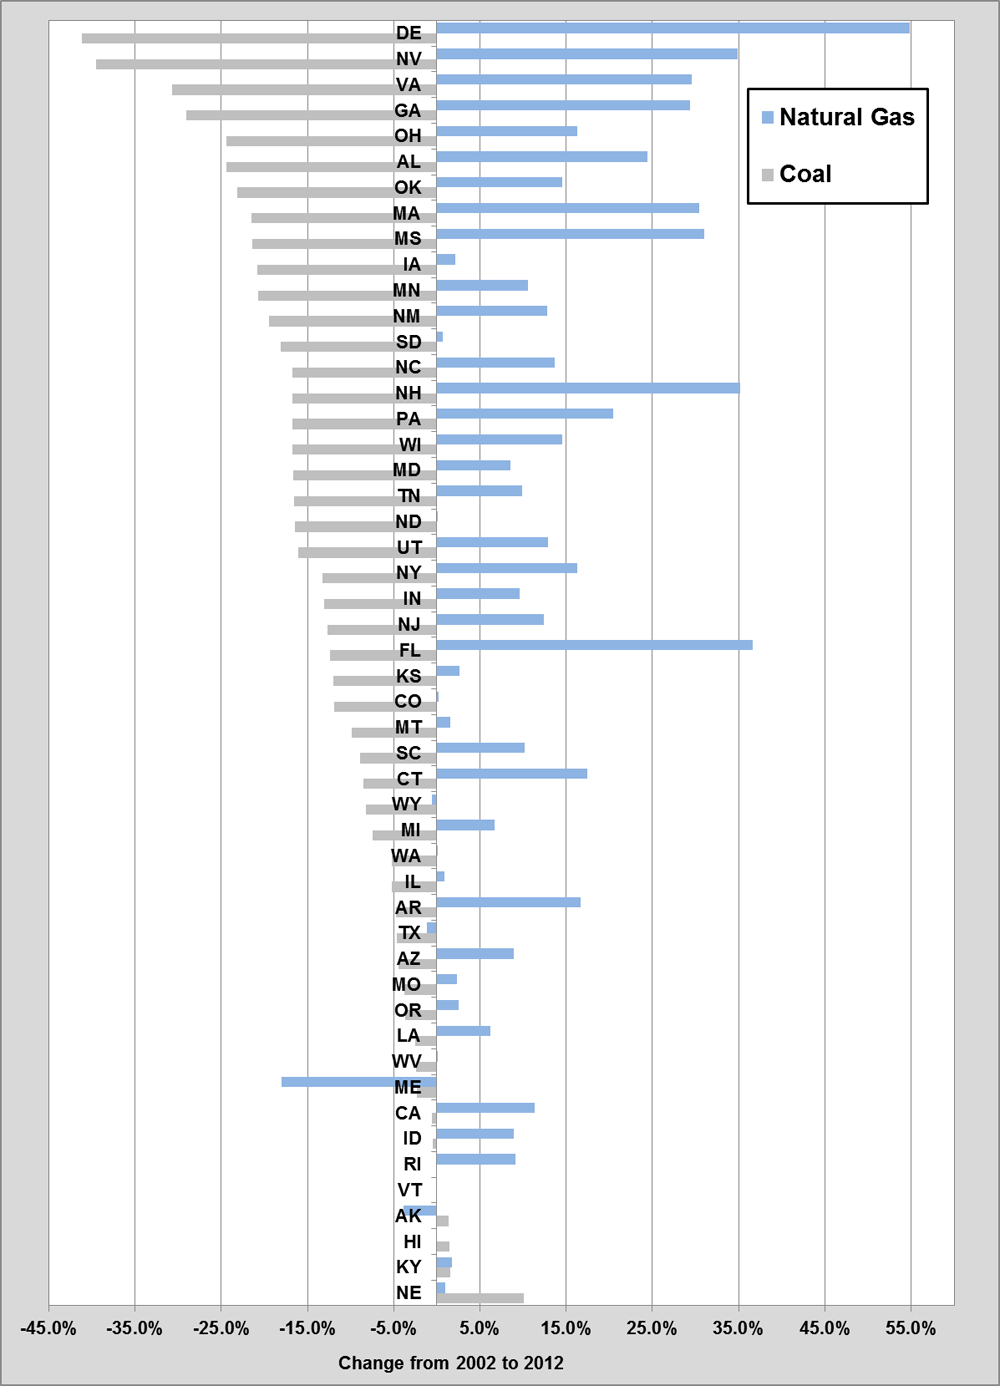
From 2002 to 2012, most states have reduced their reliance on coal for electricity generation. The figure below shows the percent change in electricity generated by coal and natural gas for each state. All but six states show a decline in the use of coal for electricity production with Delaware and Nevada reducing their use of coal by about 40%. Perhaps even more significant are the heavily populated states of Virginia, Georgia and Ohio which show declining coal use of around 25% to 30%. Many of the states that have reduced their reliance on coal are now generating more of their electricity from natural gas. Delaware’s 41.2% coal decrease is offset by an increase of 54.9% in the use of natural gas for electricity generation. In fact, there were only four states (Maine, Alaska, Texas, and Wyoming) that show a decline in electricity generated with natural gas.
Change in the Use of Coal and Natural Gas for Electricity Generation – 2002 Compared to 2012
Image

Supporting Information
| State Name | State Abbreviation | Change from 2002 to 2012 | |
|---|---|---|---|
| Coal | Natural Gas | ||
| Alaska | AK | 1.4% | -3.9% |
| Alabama | AL | -24.4% | 24.5% |
| Arkansas | AR | -4.8% | 16.7% |
| Arizona | AZ | -4.4% | 8.9% |
| California | CA | -0.6% | 11.3% |
| Colorado | CO | -11.9% | 0.2% |
| Connecticut | CT | -8.5% | 17.5% |
| Delaware | DE | -41.2% | 54.9% |
| Florida | FL | -12.4% | 36.6% |
| Georgia | GA | -29.0% | 29.3% |
| Hawaii | HI | 1.4% | 0.0% |
| Iowa | IA | -20.8% | 2.1% |
| Idaho | ID | -0.4% | 8.9% |
| Illinois | IL | -5.2% | 0.8% |
| Indiana | IN | -13.1% | 9.6% |
| Kansas | KS | -12.0% | 2.6% |
| Kentucky | KY | 1.6% | 1.8% |
| Louisiana | LA | -2.5% | 6.2% |
| Massachusetts | MA | -21.5% | 30.4% |
| Maryland | MD | -16.7% | 8.5% |
| Maine | ME | -2.4% | -18.0% |
| Michigan | MI | -7.5% | 6.7% |
| Minnesota | MN | -20.7% | 10.6% |
| Missouri | MO | -3.8% | 2.4% |
| Mississippi | MS | -21.4% | 31.1% |
| Montana | MT | -9.9% | 1.6% |
| North Carolina | NC | -16.8% | 13.7% |
| North Dakota | ND | -16.5% | 0.0% |
| Nebraska | NE | 10.0% | 0.9% |
| New Hampshire | NH | -16.8% | 35.2% |
| New Jersey | NJ | -12.7% | 12.4% |
| New Mexico | NM | -19.5% | 12.8% |
| Nevada | NV | -39.6% | 34.9% |
| New York | NY | -13.3% | 16.3% |
| Ohio | OH | -24.4% | 16.3% |
| Oklahoma | OK | -23.2% | 14.5% |
| Oregon | OR | -3.7% | 2.5% |
| Pennsylvania | PA | -16.7% | 20.5% |
| Rhode Island | RI | 0.0% | 9.1% |
| South Carolina | SC | -8.9% | 10.2% |
| South Dakota | SD | -18.1% | 0.7% |
| Tennessee | TN | -16.5% | 9.9% |
| Texas | TX | -4.7% | -1.2% |
| Utah | UT | -16.0% | 12.9% |
| Virginia | VA | -30.7% | 29.5% |
| Vermont | VT | 0.0% | 0.0% |
| Washington | WA | -5.2% | 0.1% |
| Wisconsin | WI | -16.7% | 14.6% |
| West Virginia | WV | -2.4% | 0.1% |
| Wyoming | WY | -8.2% | -0.6% |
Source: U.S. Department of Energy, Energy Information Administration, Electricity Detailed State Data, accessed September 17, 2014. | |||