
When compared to total U.S. consumption of petroleum, net imports were only 33% in 2013. The share of imported petroleum reached a peak of 60% in 2005, from a low of 27% in 1985. Since 2005, the share has declined each year.
Net Imports of Petroleum as a Share of U.S. Petroleum Consumption, 1950 - 2013
Image
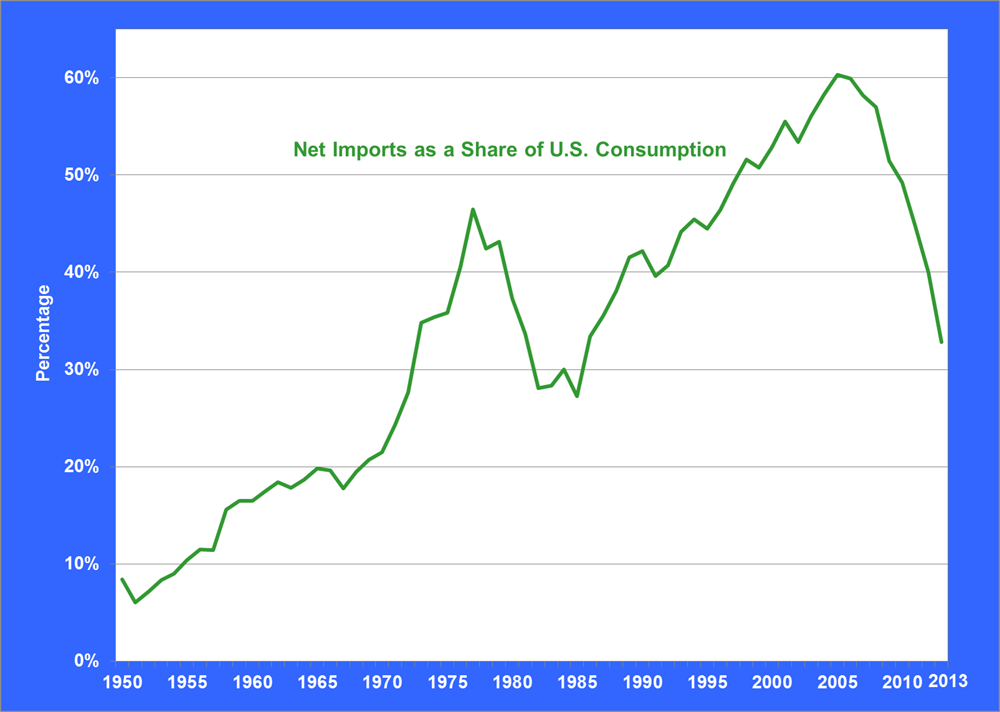
Note: Net imports are equal to total imports minus exports.
Supporting Information
| Year | Net Imports of Petroleum | U.S. Consumption of Petroleum | Net Imports as a Share of U.S. Consumption |
|---|---|---|---|
| (Million barrels per day) | Percentage | ||
| 1950 | 0.55 | 6.46 | 8.4% |
| 1951 | 0.42 | 7.02 | 6.0% |
| 1952 | 0.52 | 7.27 | 7.2% |
| 1953 | 0.63 | 7.60 | 8.3% |
| 1954 | 0.70 | 7.76 | 9.0% |
| 1955 | 0.88 | 8.46 | 10.4% |
| 1956 | 1.01 | 8.78 | 11.5% |
| 1957 | 1.01 | 8.81 | 11.4% |
| 1958 | 1.42 | 9.12 | 15.6% |
| 1959 | 1.57 | 9.53 | 16.5% |
| 1960 | 1.61 | 9.80 | 16.5% |
| 1961 | 1.74 | 9.98 | 17.5% |
| 1962 | 1.91 | 10.40 | 18.4% |
| 1963 | 1.91 | 10.74 | 17.8% |
| 1964 | 2.06 | 11.02 | 18.7% |
| 1965 | 2.28 | 11.51 | 19.8% |
| 1966 | 2.37 | 12.08 | 19.7% |
| 1967 | 2.23 | 12.56 | 17.8% |
| 1968 | 2.61 | 13.39 | 19.5% |
| 1969 | 2.93 | 14.14 | 20.7% |
| 1970 | 3.16 | 14.70 | 21.5% |
| 1971 | 3.70 | 15.21 | 24.3% |
| 1972 | 4.52 | 16.37 | 27.6% |
| 1973 | 6.02 | 17.31 | 34.8% |
| 1974 | 5.89 | 16.65 | 35.4% |
| 1975 | 5.85 | 16.32 | 35.8% |
| 1976 | 7.09 | 17.46 | 40.6% |
| 1977 | 8.56 | 18.43 | 46.5% |
| 1978 | 8.00 | 18.85 | 42.5% |
| 1979 | 7.99 | 18.51 | 43.1% |
| 1980 | 6.36 | 17.06 | 37.3% |
| 1981 | 5.40 | 16.06 | 33.6% |
| 1982 | 4.30 | 15.30 | 28.1% |
| 1983 | 4.31 | 15.23 | 28.3% |
| 1984 | 4.72 | 15.73 | 30.0% |
| 1985 | 4.29 | 15.73 | 27.3% |
| 1986 | 5.44 | 16.28 | 33.4% |
| 1987 | 5.91 | 16.67 | 35.5% |
| 1988 | 6.59 | 17.28 | 38.1% |
| 1989 | 7.20 | 17.33 | 41.6% |
| 1990 | 7.16 | 16.99 | 42.2% |
| 1991 | 6.63 | 16.71 | 39.6% |
| 1992 | 6.94 | 17.03 | 40.7% |
| 1993 | 7.62 | 17.24 | 44.2% |
| 1994 | 8.05 | 17.72 | 45.5% |
| 1995 | 7.89 | 17.72 | 44.5% |
| 1996 | 8.50 | 18.31 | 46.4% |
| 1997 | 9.16 | 18.62 | 49.2% |
| 1998 | 9.76 | 18.92 | 51.6% |
| 1999 | 9.91 | 19.52 | 50.8% |
| 2000 | 10.42 | 19.70 | 52.9% |
| 2001 | 10.90 | 19.65 | 55.5% |
| 2002 | 10.55 | 19.76 | 53.4% |
| 2003 | 11.24 | 20.03 | 56.1% |
| 2004 | 12.10 | 20.73 | 58.4% |
| 2005 | 12.55 | 20.80 | 60.3% |
| 2006 | 12.39 | 20.69 | 59.9% |
| 2007 | 12.04 | 20.68 | 58.2% |
| 2008 | 11.11 | 19.50 | 57.0% |
| 2009 | 9.67 | 18.77 | 51.5% |
| 2010 | 9.44 | 19.18 | 49.2% |
| 2011 | 8.45 | 18.88 | 44.8% |
| 2012 | 7.39 | 18.49 | 40.0% |
| 2013 | 6.20 | 18.89 | 32.8% |
| Source: U.S. Department of Energy, Energy Information Administration, Monthly Energy Review, August 2014, Table 3.3a. | |||