
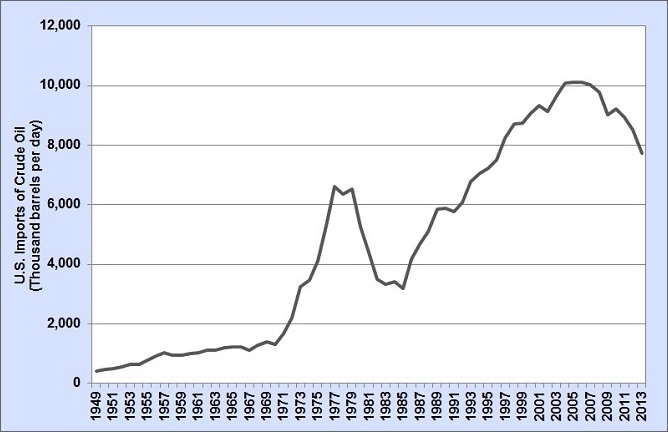
Imports of crude oil to the U.S. were on an upward trend for about 20 years. During this period, imports increased from 3.2 million barrels per day in 1986 to 10.1 million barrels per day in 2006. Since 2006, this trend has reversed, with imports of crude oil declining to 7.7 million barrels per day by 2013.
U.S. Imports of Crude Oil, 1980-2013
Image

Image
Supporting Information
| Year | Million Barrels per Day |
|---|---|
| 1980 | 5.3 |
| 1981 | 4.4 |
| 1982 | 3.5 |
| 1983 | 3.3 |
| 1984 | 3.4 |
| 1985 | 3.2 |
| 1986 | 4.2 |
| 1987 | 4.7 |
| 1988 | 5.1 |
| 1989 | 5.8 |
| 1990 | 5.9 |
| 1991 | 5.8 |
| 1992 | 6.1 |
| 1993 | 6.8 |
| 1994 | 7.1 |
| 1995 | 7.2 |
| 1996 | 7.5 |
| 1997 | 8.2 |
| 1998 | 8.7 |
| 1999 | 8.7 |
| 2000 | 9.1 |
| 2001 | 9.3 |
| 2002 | 9.1 |
| 2003 | 9.7 |
| 2004 | 10.1 |
| 2005 | 10.1 |
| 2006 | 10.1 |
| 2007 | 10.0 |
| 2008 | 9.8 |
| 2009 | 9.0 |
| 2010 | 9.2 |
| 2011 | 8.9 |
| 2012 | 8.5 |
| 2013 | 7.7 |
| Source: U.S. Energy Information Administration, Monthly Energy Review, January 2014, Table 3.3b. Website accessed Feb 12, 2014. | |