
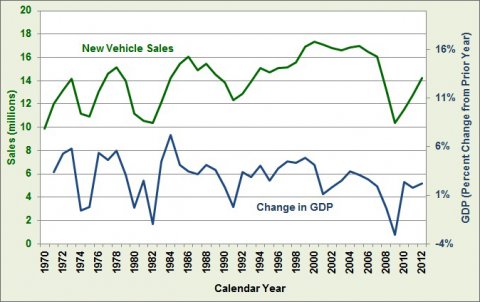
Over the last four decades, new light vehicle sales have gone from a low of 9.9 million vehicles in 1970 to a high of 17.1 million vehicles sold in 2001, but along the way, there have been significant ups and downs. Those ups and downs are also reflected in the change in Gross Domestic Product (GDP) over time which shows a trend similar to the vehicle sales trend. Vehicle sales have been climbing since the recent low point in 2009.
Light Vehicle Sales, 1970-2012
Image
Image
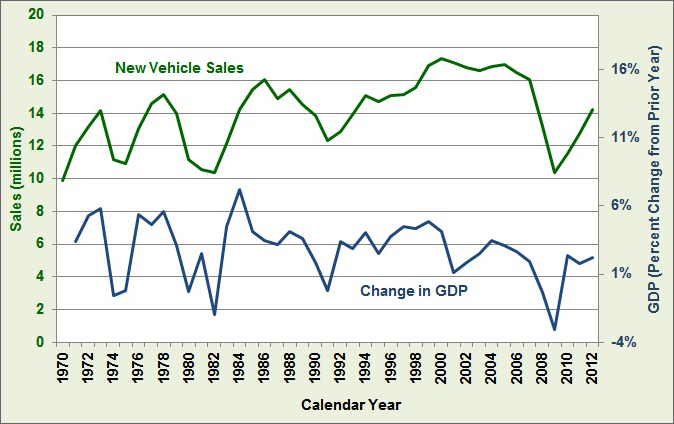
Note: New vehicle sales include cars and light trucks up to 14,000 lbs. gross vehicle weight rating.
Supporting Information
| Year | Light Vehicle Sales | Percent Change in Gross Domestic Product From Prior Year |
|---|---|---|
| 1970 | 9.9 | |
| 1971 | 12.0 | 3.4% |
| 1972 | 13.2 | 5.3% |
| 1973 | 14.2 | 5.8% |
| 1974 | 11.2 | -0.6% |
| 1975 | 10.9 | -0.2% |
| 1976 | 13.1 | 5.4% |
| 1977 | 14.6 | 4.6% |
| 1978 | 15.1 | 5.6% |
| 1979 | 14.0 | 3.1% |
| 1980 | 11.2 | -0.3% |
| 1981 | 10.5 | 2.5% |
| 1982 | 10.4 | -1.9% |
| 1983 | 12.1 | 4.5% |
| 1984 | 14.2 | 7.2% |
| 1985 | 15.4 | 4.1% |
| 1986 | 16.1 | 3.5% |
| 1987 | 14.9 | 3.2% |
| 1988 | 15.5 | 4.1% |
| 1989 | 14.5 | 3.6% |
| 1990 | 13.9 | 1.9% |
| 1991 | 12.3 | -0.2% |
| 1992 | 12.9 | 3.4% |
| 1993 | 13.9 | 2.9% |
| 1994 | 15.1 | 4.1% |
| 1995 | 14.7 | 2.5% |
| 1996 | 15.1 | 3.7% |
| 1997 | 15.1 | 4.5% |
| 1998 | 15.5 | 4.4% |
| 1999 | 16.9 | 4.8% |
| 2000 | 17.4 | 4.1% |
| 2001 | 17.1 | 1.1% |
| 2002 | 16.8 | 1.8% |
| 2003 | 16.6 | 2.5% |
| 2004 | 16.9 | 3.5% |
| 2005 | 16.9 | 3.1% |
| 2006 | 16.5 | 2.7% |
| 2007 | 16.1 | 1.9% |
| 2008 | 13.2 | -0.3% |
| 2009 | 10.4 | -3.1% |
| 2010 | 11.6 | 2.4% |
| 2011 | 12.7 | 1.8% |
| 2012 | 14.3 | 2.2% |
| Source: Light Vehicle Sales: Oak Ridge National Laboratory, Transportation Energy Data Book: Edition 31. Gross Domestic Product: Bureau of Economic Analysis, National Product and Income Accounts, Table 1.1.6. Real Gross Domestic Product, Chained Dollars. | ||