
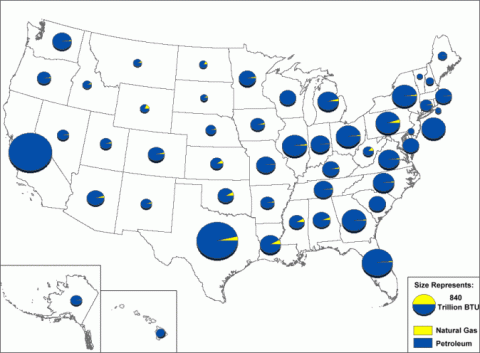
The map below shows the amount of petroleum and natural gas consumed in the transportation sector by state for 2010. The pie charts for each state are scaled based on total consumption of petroleum and natural gas. The yellow slice of the pie chart represents the share that is natural gas versus petroleum which is shaded blue. Overall consumption tends to follow population density; however, the share of natural gas consumption is usually greater in those states involved in the petroleum, gas, and mining industries like in the Gulf States, Oklahoma, Pennsylvania, West Virginia, and Wyoming. Transportation use of natural gas is consumed in the operation of pipelines and to a lesser extent as vehicle fuel.
Petroleum and Natural Gas Consumption for Transportation by State, 2010
Image
Image
Supporting Information
| State | Natural Gas | Petroleum | Both Natural Gas and Petroleum |
|---|---|---|---|
| Alabama | 22.6 | 463.0 | 485.6 |
| Alaska | 3.3 | 207.3 | 210.6 |
| Arizona | 18.1 | 459.7 | 477.8 |
| Arkansas | 9.6 | 284.7 | 294.3 |
| California | 24.7 | 3,064.0 | 3,088.7 |
| Colorado | 14.8 | 415.0 | 429.8 |
| Connecticut | 7.0 | 235.9 | 242.9 |
| Delaware | 0.1 | 66.6 | 66.7 |
| Dist. of Col. | 1.2 | 14.8 | 16.0 |
| Florida | 23.5 | 1,534.4 | 1,557.9 |
| Georgia | 9.9 | 972.5 | 982.4 |
| Hawaii | 0.0 | 134.0 | 134.0 |
| Idaho | 7.9 | 128.7 | 136.6 |
| Illinois | 20.3 | 965.7 | 986.0 |
| Indiana | 8.9 | 607.4 | 616.3 |
| Iowa | 11.1 | 301.3 | 312.4 |
| Kansas | 24.8 | 243.2 | 268.0 |
| Kentucky | 14.0 | 460.3 | 474.3 |
| Louisiana | 48.0 | 646.1 | 694.1 |
| Maine | 1.8 | 124.1 | 125.9 |
| Maryland | 3.1 | 434.0 | 437.1 |
| Massachusetts | 4.8 | 450.3 | 455.1 |
| Michigan | 25.6 | 715.6 | 741.2 |
| Minnesota | 15.6 | 467.1 | 482.7 |
| Mississippi | 28.6 | 339.8 | 368.4 |
| Missouri | 5.9 | 565.7 | 571.6 |
| Montana | 7.5 | 104.4 | 111.9 |
| Nebraska | 7.4 | 174.8 | 182.2 |
| Nevada | 4.0 | 206.8 | 210.8 |
| New Hampshire | 0.3 | 106.4 | 106.7 |
| New Jersey | 5.7 | 944.1 | 949.8 |
| New Mexico | 9.0 | 190.0 | 199.0 |
| New York | 19.0 | 993.4 | 1,012.4 |
| North Carolina | 8.1 | 713.5 | 721.6 |
| North Dakota | 14.5 | 88.2 | 102.7 |
| Ohio | 16.5 | 941.7 | 958.2 |
| Oklahoma | 31.8 | 388.3 | 420.1 |
| Oregon | 6.6 | 312.6 | 319.2 |
| Pennsylvania | 49.5 | 934.3 | 983.8 |
| Rhode Island | 1.6 | 62.4 | 64.0 |
| South Carolina | 3.5 | 457.7 | 461.2 |
| South Dakota | 5.8 | 89.2 | 95.0 |
| Tennessee | 10.3 | 599.5 | 609.8 |
| Texas | 84.9 | 2,729.9 | 2,814.8 |
| Utah | 11.0 | 222.9 | 233.9 |
| Vermont | 0.0 | 52.3 | 52.3 |
| Virginia | 10.5 | 734.1 | 744.6 |
| Washington | 8.4 | 604.2 | 612.6 |
| West Virginia | 23.2 | 151.4 | 174.6 |
| Wisconsin | 3.1 | 440.0 | 443.1 |
| Wyoming | 19.9 | 102.9 | 122.8 |
| Total U.S. | 717.3 | 26,646.2 | 27,363.5 |
| Source: Energy Information Administration Beta website, State Profiles and Energy Estimates, Table C8. | |||