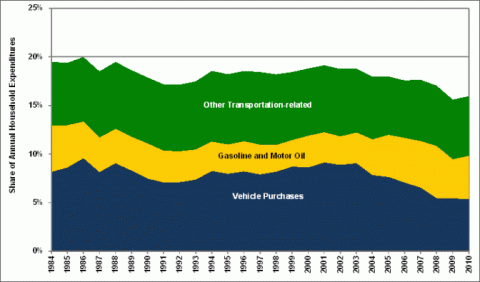
The overall share of annual household expenditures for transportation was lower in 2010 than it was in 1984, reaching its lowest point in 2009 at 15.5%. In the early to mid-1980s when oil prices were high, gasoline and motor oil made up a larger share of transportation expenditures but then declined until about 2004 when gasoline and motor oil expenditures began to rise again. The share of household expenditures on gasoline and oil was exactly the same in 1985 as it was twenty five years later in 2010 at 4.4%. During this period, expenditures for vehicle purchases declined to the lowest level in 2009 and remained constant for 2010 at 5.4%.
Share of Household Expenditures on Transportation, 1984-2010
Note: Other transportation-related expenditures include vehicle finance charges, maintenance and repairs, vehicle insurance, vehicle rental, leases, licenses and other charges, and public transportation.
Supporting Information
| Year | Vehicle Purchases | Gasoline and Motor Oil | Other Transportation related | Annual Household Expenditures (current dollars) |
|---|---|---|---|---|
| 1984 | 8.2% | 4.8% | 6.6% | $22,546 |
| 1985 | 8.6% | 4.4% | 6.4% | $23,976 |
| 1986 | 9.6% | 3.8% | 6.6% | $24,439 |
| 1987 | 8.1% | 3.6% | 6.8% | $24,776 |
| 1988 | 9.0% | 3.5% | 6.9% | $26,389 |
| 1989 | 8.3% | 3.5% | 6.9% | $28,323 |
| 1990 | 7.5% | 3.6% | 6.8% | $29,062 |
| 1991 | 7.1% | 3.3% | 6.8% | $30,487 |
| 1992 | 7.1% | 3.2% | 6.9% | $30,527 |
| 1993 | 7.4% | 3.1% | 7.0% | $31,436 |
| 1994 | 8.3% | 3.0% | 7.3% | $32,740 |
| 1995 | 8.0% | 3.0% | 7.2% | $33,597 |
| 1996 | 8.2% | 3.1% | 7.2% | $35,591 |
| 1997 | 7.9% | 3.1% | 7.5% | $36,146 |
| 1998 | 8.2% | 2.8% | 7.3% | $37,260 |
| 1999 | 8.7% | 2.7% | 7.0% | $39,143 |
| 2000 | 8.6% | 3.3% | 6.9% | $40,238 |
| 2001 | 9.1% | 3.1% | 6.9% | $41,395 |
| 2002 | 8.9% | 2.9% | 6.9% | $42,557 |
| 2003 | 9.1% | 3.2% | 6.6% | $42,742 |
| 2004 | 7.8% | 3.7% | 6.5% | $43,395 |
| 2005 | 7.6% | 4.3% | 6.0% | $46,409 |
| 2006 | 7.1% | 4.6% | 5.9% | $48,398 |
| 2007 | 6.5% | 4.8% | 6.3% | $49,638 |
| 2008 | 5.5% | 5.4% | 6.2% | $50,486 |
| 2009 | 5.4% | 4.0% | 6.1% | $49,067 |
| 2010 | 5.4% | 4.4% | 6.1% | $48,109 |
| Source: U.S. Department of Labor, Consumer Expenditure Survey 2010, Table 2, 2011. | ||||


