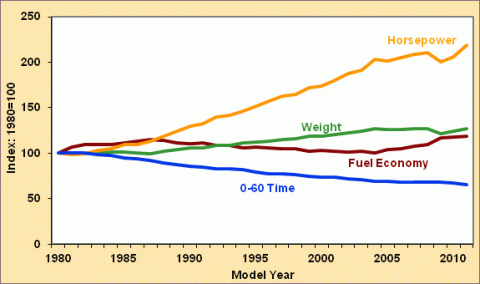
In addition to a 120% increase in horsepower and 35% decrease in 0-60 time from 1980 to 2011, the fuel economy of vehicles improved nearly 19%. All of these data series are sales-weighted averages that have been indexed to 1980, showing the relative relationship among the years since 1980. In the graph, the weight of the vehicle appears to mirror fuel economy, showing the close relationship between the two.
Characteristics of New Light Vehicles, 1980-2011
Supporting Information
| Actual Values | Index Values (1980=100) | ||||||||
|---|---|---|---|---|---|---|---|---|---|
| Model Year | Fuel Economy (Miles per Gallon) | Weight (Pounds) | Horse-power | 0-60 Time (Seconds) | Fuel Economy | Weight | Horse-power | 0-60 Time | |
| 1980 | 19.2 | 3,228 | 104 | 14.3 | 100 | 100 | 100 | 100 | |
| 1981 | 20.5 | 3,202 | 102 | 14.4 | 107 | 99 | 98 | 101 | |
| 1982 | 21.1 | 3,202 | 103 | 14.4 | 110 | 99 | 99 | 101 | |
| 1983 | 21.0 | 3,257 | 107 | 14.1 | 109 | 101 | 103 | 99 | |
| 1984 | 21.0 | 3,262 | 109 | 14.0 | 109 | 101 | 105 | 98 | |
| 1985 | 21.3 | 3,271 | 114 | 13.5 | 111 | 101 | 110 | 94 | |
| 1986 | 21.8 | 3,238 | 114 | 13.4 | 114 | 100 | 110 | 94 | |
| 1987 | 22.0 | 3,221 | 118 | 13.1 | 115 | 100 | 113 | 92 | |
| 1988 | 21.9 | 3,283 | 123 | 12.8 | 114 | 102 | 118 | 90 | |
| 1989 | 21.4 | 3,351 | 129 | 12.5 | 111 | 104 | 124 | 87 | |
| 1990 | 21.2 | 3,426 | 135 | 12.2 | 110 | 106 | 130 | 85 | |
| 1991 | 21.3 | 3,410 | 138 | 12.1 | 111 | 106 | 133 | 85 | |
| 1992 | 20.8 | 3,512 | 145 | 11.8 | 108 | 109 | 139 | 83 | |
| 1993 | 20.9 | 3,519 | 147 | 11.8 | 109 | 109 | 141 | 83 | |
| 1994 | 20.4 | 3,603 | 152 | 11.7 | 106 | 112 | 146 | 82 | |
| 1995 | 20.5 | 3,613 | 158 | 11.3 | 107 | 112 | 152 | 79 | |
| 1996 | 20.4 | 3,659 | 164 | 11.1 | 106 | 113 | 158 | 78 | |
| 1997 | 20.1 | 3,727 | 169 | 11.0 | 105 | 115 | 163 | 77 | |
| 1998 | 20.1 | 3,744 | 171 | 10.9 | 105 | 116 | 164 | 76 | |
| 1999 | 19.7 | 3,835 | 179 | 10.7 | 103 | 119 | 172 | 75 | |
| 2000 | 19.8 | 3,821 | 181 | 10.6 | 103 | 118 | 174 | 74 | |
| 2001 | 19.6 | 3,879 | 187 | 10.5 | 102 | 120 | 180 | 73 | |
| 2002 | 19.5 | 3,951 | 195 | 10.3 | 102 | 122 | 188 | 72 | |
| 2003 | 19.6 | 3,999 | 199 | 10.2 | 102 | 124 | 191 | 71 | |
| 2004 | 19.3 | 4,111 | 211 | 9.9 | 101 | 127 | 203 | 69 | |
| 2005 | 19.9 | 4,059 | 209 | 9.9 | 104 | 126 | 201 | 69 | |
| 2006 | 20.1 | 4,067 | 213 | 9.8 | 105 | 126 | 205 | 69 | |
| 2007 | 20.6 | 4,093 | 217 | 9.7 | 107 | 127 | 209 | 68 | |
| 2008 | 21.0 | 4,085 | 219 | 9.7 | 109 | 127 | 211 | 68 | |
| 2009 | 22.4 | 3,914 | 208 | 9.7 | 117 | 121 | 200 | 68 | |
| 2010 | 22.6 | 4,002 | 214 | 9.6 | 118 | 124 | 206 | 67 | |
| 2011 | 22.8 | 4,084 | 228 | 9.3 | 119 | 127 | 219 | 65 | |
Source: | |||||||||


