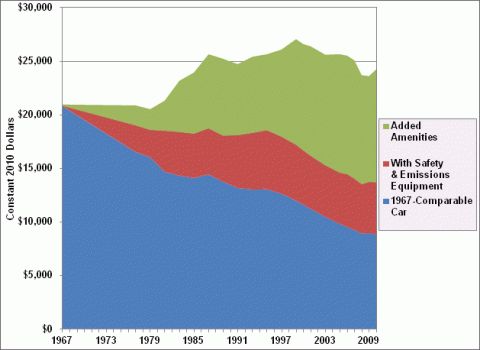
While the overall price of a new car has not increased greatly from 1967 to 2010 when adjusted for inflation, the costs associated with added amenities like navigation, telematics, power seats and windows have grown substantially. Costs related to safety and emissions equipment grew through the mid-1990s but have remained fairly steady since. These increased costs are largely off-set by the decreasing cost of a basic car comparable to a car produced in 1967 without all of the added equipment.
Average Expenditure per New Car, 1967-2010
Supporting Information
| Year | 1967-Comparable Car | With Safety & Emissions Equipment | Added Amenities |
|---|---|---|---|
| 1967 | 20,794 | 72 | 131 |
| 1968 | 20,367 | 316 | 305 |
| 1969 | 19,940 | 560 | 480 |
| 1970 | 19,514 | 805 | 655 |
| 1971 | 19,087 | 1,049 | 830 |
| 1972 | 18,660 | 1,294 | 1,004 |
| 1973 | 18,234 | 1,538 | 1,179 |
| 1974 | 17,807 | 1,782 | 1,354 |
| 1975 | 17,380 | 2,027 | 1,529 |
| 1976 | 16,954 | 2,271 | 1,704 |
| 1977 | 16,527 | 2,515 | 1,878 |
| 1978 | 16,278 | 2,551 | 1,914 |
| 1979 | 16,030 | 2,586 | 1,949 |
| 1980 | 15,349 | 3,225 | 2,395 |
| 1981 | 14,669 | 3,865 | 2,840 |
| 1982 | 14,498 | 3,980 | 3,819 |
| 1983 | 14,327 | 4,096 | 4,797 |
| 1984 | 14,214 | 4,131 | 5,260 |
| 1985 | 14,101 | 4,167 | 5,723 |
| 1986 | 14,266 | 4,249 | 6,327 |
| 1987 | 14,431 | 4,332 | 6,931 |
| 1988 | 14,096 | 4,327 | 7,061 |
| 1989 | 13,760 | 4,321 | 7,191 |
| 1990 | 13,464 | 4,639 | 6,921 |
| 1991 | 13,167 | 4,958 | 6,651 |
| 1992 | 13,096 | 5,137 | 6,885 |
| 1993 | 13,025 | 5,315 | 7,120 |
| 1994 | 13,033 | 5,429 | 7,115 |
| 1995 | 13,042 | 5,543 | 7,111 |
| 1996 | 12,836 | 5,450 | 7,629 |
| 1997 | 12,631 | 5,357 | 8,146 |
| 1998 | 12,308 | 5,301 | 9,011 |
| 1999 | 11,985 | 5,245 | 9,877 |
| 2000 | 11,595 | 5,103 | 9,945 |
| 2001 | 11,224 | 4,979 | 10,237 |
| 2002 | 10,849 | 4,910 | 10,287 |
| 2003 | 10,474 | 4,841 | 10,338 |
| 2004 | 10,149 | 4,818 | 10,708 |
| 2005 | 9,824 | 4,795 | 11,079 |
| 2006 | 9,518 | 4,964 | 11,081 |
| 2007 | 9,252 | 4,803 | 11,072 |
| 2008 | 8,905 | 4,644 | 10,192 |
| 2009 | 8,960 | 4,801 | 9,897 |
| 2010 | 8,807 | 4,915 | 10,574 |
Source: Ward's Automotive, Ward's Motor Vehicles Facts and Figures 2011. Original source: U.S. Department of Labor, Bureau of Labor Statistics. Adjusted by the Consumer Price Inflation index. | |||


