
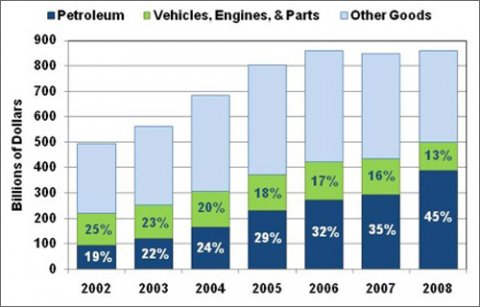
As recently as 2002, the petroleum trade balance accounted for less than 20% of the total U.S. goods trade deficit. In 2008, however, petroleum accounted for 45% of the trade deficit. However, as petroleum's share of the deficit grew, the deficit for vehicles, engines and parts went from 25% in 2002 to 13% in 2008.
U.S. Goods Trade Deficit, 2002-2008
Image
Image
Supporting Information
| Year | (Billions of Dollars) | Petroleum Share of Total | Vehicles, Engines & Parts Share of Total | |||
|---|---|---|---|---|---|---|
| Petroleum | Vehicles, Engines, & Parts | Other Goods | Total | |||
| 2002 | 94 | 125 | 275 | 494 | 19% | 25% |
| 2003 | 122 | 130 | 311 | 563 | 22% | 23% |
| 2004 | 166 | 139 | 380 | 685 | 24% | 20% |
| 2005 | 231 | 141 | 430 | 802 | 29% | 18% |
| 2006 | 272 | 149 | 439 | 861 | 32% | 17% |
| 2007 | 295 | 138 | 415 | 848 | 35% | 16% |
| 2008 | 388 | 112 | 359 | 860 | 45% | 13% |
Source: U.S. Department of Commerce, Bureau of Economic Analysis, National Income and Product Accounts, Table 4.2.5, August 2009. | ||||||