
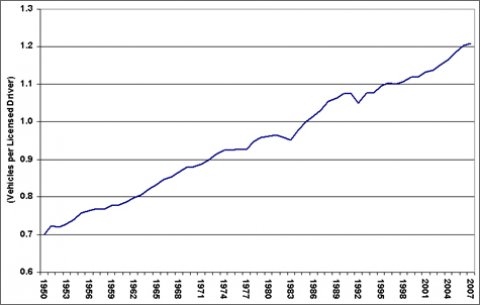
The number of vehicles in operation per licensed driver has risen steadily since 1950. In 1985, for the first time, there was one vehicle for every licensed driver. Since 1985, the number of vehicles in operation has exceeded the number of licensed drivers reaching a level of 1.21 vehicles per licensed driver in 2007.
Vehicles per Licensed Driver, 1950-2007
Image
Image

Supporting Information
| Year | Vehicles per Licensed Driver |
|---|---|
| 1950 | 0.70 |
| 1951 | 0.72 |
| 1952 | 0.72 |
| 1953 | 0.73 |
| 1954 | 0.74 |
| 1955 | 0.76 |
| 1956 | 0.76 |
| 1957 | 0.77 |
| 1958 | 0.77 |
| 1959 | 0.78 |
| 1960 | 0.78 |
| 1961 | 0.79 |
| 1962 | 0.80 |
| 1963 | 0.81 |
| 1964 | 0.82 |
| 1965 | 0.83 |
| 1966 | 0.85 |
| 1967 | 0.85 |
| 1968 | 0.86 |
| 1969 | 0.88 |
| 1970 | 0.88 |
| 1971 | 0.89 |
| 1972 | 0.90 |
| 1973 | 0.92 |
| 1974 | 0.92 |
| 1975 | 0.92 |
| 1976 | 0.93 |
| 1977 | 0.93 |
| 1978 | 0.95 |
| 1979 | 0.96 |
| 1980 | 0.96 |
| 1981 | 0.96 |
| 1982 | 0.96 |
| 1983 | 0.95 |
| 1984 | 0.98 |
| 1985 | 1.00 |
| 1986 | 1.02 |
| 1987 | 1.03 |
| 1988 | 1.05 |
| 1989 | 1.06 |
| 1990 | 1.07 |
| 1991 | 1.07 |
| 1992 | 1.05 |
| 1993 | 1.08 |
| 1994 | 1.08 |
| 1995 | 1.10 |
| 1996 | 1.10 |
| 1997 | 1.10 |
| 1998 | 1.11 |
| 1999 | 1.12 |
| 2000 | 1.12 |
| 2001 | 1.13 |
| 2002 | 1.14 |
| 2003 | 1.15 |
| 2004 | 1.16 |
| 2005 | 1.19 |
| 2006 | 1.20 |
| 2007 | 1.21 |
Source: Licensed drivers – U.S. Department of Transportation, Federal Highway Administration, Highway Statistics 2007, Table DL-1C. | |