
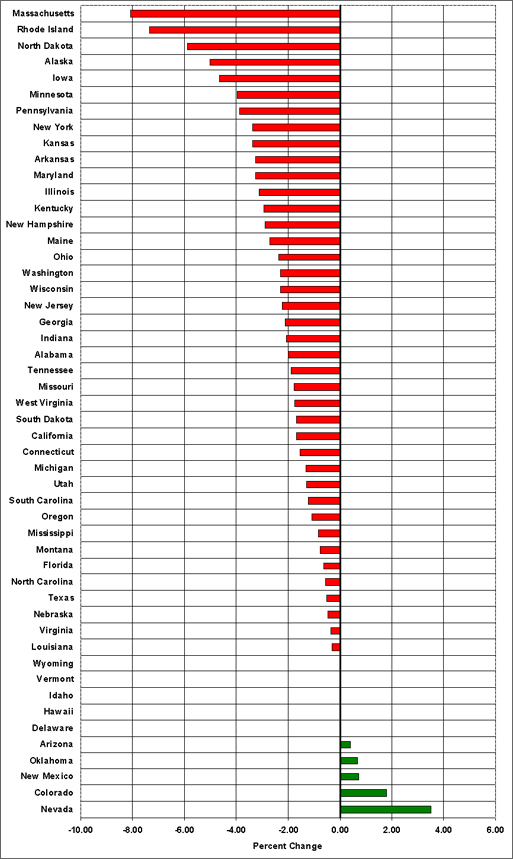
From 2007 to 2008 the total number of new car dealerships in the U.S. declined by 430 dealerships or about 2%. During this period, most states lost dealerships while 10 states remained the same or increased their number of dealerships. Massachusetts lost 42 dealerships representing a decline of 8%. On the other side of the spectrum, Nevada gained 4 dealerships resulting in a gain of 3.5%.
New Light Vehicle Dealerships by State, 2007 and 2008
Image

Image
Supporting Information
| State | 2007 | 2008 | Change | Percent Change |
|---|---|---|---|---|
| Alabama | 352 | 345 | -7 | -2.0 |
| Alaska | 40 | 38 | -2 | -5.0 |
| Arizona | 255 | 256 | 1 | 0.4 |
| Arkansas | 276 | 267 | -9 | -3.3 |
| California | 1,621 | 1,594 | -27 | -1.7 |
| Colorado | 279 | 284 | 5 | 1.8 |
| Connecticut | 325 | 320 | -5 | -1.5 |
| Delaware | 65 | 65 | 0 | 0.0 |
| D.C. | 2 | 1 | -1 | -50.0 |
| Florida | 954 | 948 | -6 | -0.6 |
| Georgia | 616 | 603 | -13 | -2.1 |
| Hawaii | 66 | 66 | 0 | 0.0 |
| Idaho | 123 | 123 | 0 | 0.0 |
| Illinois | 964 | 934 | -30 | -3.1 |
| Indiana | 532 | 521 | -11 | -2.1 |
| Iowa | 387 | 369 | -18 | -4.7 |
| Kansas | 267 | 258 | -9 | -3.4 |
| Kentucky | 307 | 298 | -9 | -2.9 |
| Louisiana | 338 | 337 | -1 | -0.3 |
| Maine | 148 | 144 | -4 | -2.7 |
| Maryland | 370 | 358 | -12 | -3.2 |
| Massachusetts | 520 | 478 | -42 | -8.1 |
| Michigan | 769 | 759 | -10 | -1.3 |
| Minnesota | 456 | 438 | -18 | -3.9 |
| Mississippi | 244 | 242 | -2 | -0.8 |
| Missouri | 503 | 494 | -9 | -1.8 |
| Montana | 133 | 132 | -1 | -0.8 |
| Nebraska | 214 | 213 | -1 | -0.5 |
| Nevada | 114 | 118 | 4 | 3.5 |
| New Hampshire | 174 | 169 | -5 | -2.9 |
| New Jersey | 587 | 574 | -13 | -2.2 |
| New Mexico | 139 | 140 | 1 | 0.7 |
| New York | 1,151 | 1,112 | -39 | -3.4 |
| North Carolina | 696 | 692 | -4 | -0.6 |
| North Dakota | 102 | 96 | -6 | -5.9 |
| Ohio | 981 | 958 | -23 | -2.3 |
| Oklahoma | 297 | 299 | 2 | 0.7 |
| Oregon | 277 | 274 | -3 | -1.1 |
| Pennsylvania | 1,208 | 1,161 | -47 | -3.9 |
| Rhode Island | 68 | 63 | -5 | -7.4 |
| South Carolina | 330 | 326 | -4 | -1.2 |
| South Dakota | 119 | 117 | -2 | -1.7 |
| Tennessee | 428 | 420 | -8 | -1.9 |
| Texas | 1,353 | 1,346 | -7 | -0.5 |
| Utah | 155 | 153 | -2 | -1.3 |
| Vermont | 97 | 97 | 0 | 0.0 |
| Virginia | 553 | 551 | -2 | -0.4 |
| Washington | 392 | 383 | -9 | -2.3 |
| West Virginia | 172 | 169 | -3 | -1.7 |
| Wisconsin | 611 | 597 | -14 | -2.3 |
| Wyoming | 70 | 70 | 0 | 0.0 |
| Total | 21,200 | 20,770 | -430 | -2.0 |
Note: The District of Columbia is not depicted on the graph. | ||||