
Average congestion on monitored roadways in America’s urban areas has improved by 47 minutes per day since 2014.
Transportation Technologies Office
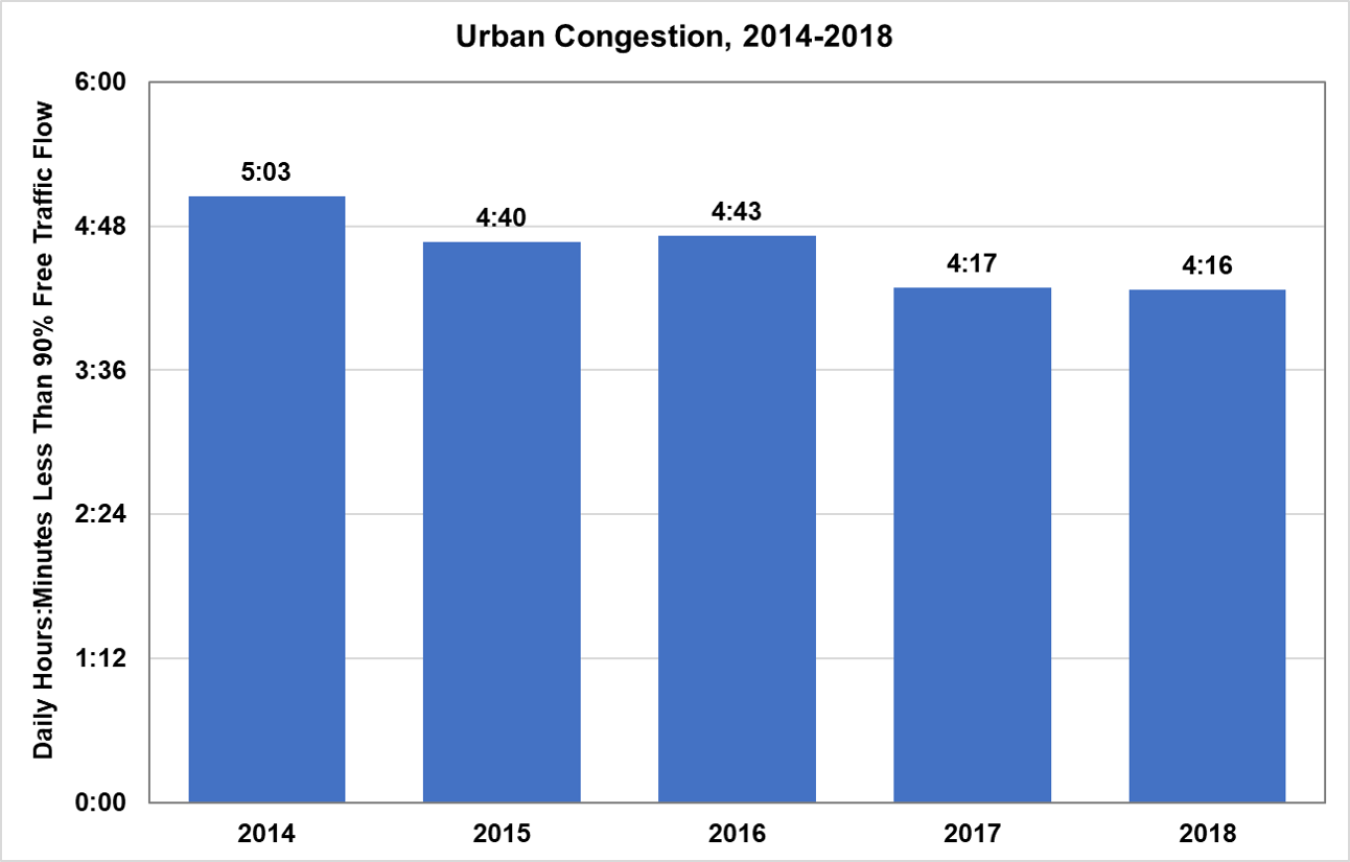
January 6, 2020The Federal Highway Administration (FHWA) produces annual congestion measurements for the 52 largest urban areas in the United States using data from the National Performance Management Research Data Set (NPMRDS). For the past five years, FHWA has measured the average length of time per day that monitored roadways were at less than 90% of free traffic flow. In 2018, urban congestion resulted in 4 hours and 16 minutes of traffic per day that were at less than 90% of free traffic flow, an improvement of 47 minutes over 2014, when there were 5 hours and 3 minutes of congestion per day.
Note: The NPMRDS covers the National Highway System and some additional roadways near border crossings. The data are available here.
Source: U.S. Department of Transportation, Federal Highway Administration, 2018 Urban Congestion Trends, February 2019, and each annual report back to 2014.