
Vehicle miles traveled and the gross domestic product in the U.S. grew at the same rate from 1960 to 1997. After that time, GDP growth outpaced VMT.
April 2, 2018The number of vehicle miles traveled (VMT) in the United States and the U.S. gross domestic product (GDP) grew at the same rate from 1960 to 1997 (3.5% average annual growth). After that time, GDP growth outpaced VMT – average annual growth in GDP of 2.1%, compared to 1% for VMT. Despite increases in VMT from 2011-on, the gap between GDP and VMT is the largest in 2017. There are many causes contributing to this trend such as societal and work organization changes, technology adoption, and growth of economic activity that does not increase travel (e.g., software development, banking industry). Going forward, VMT may be constrained by infrastructure capacity, while GDP is not.
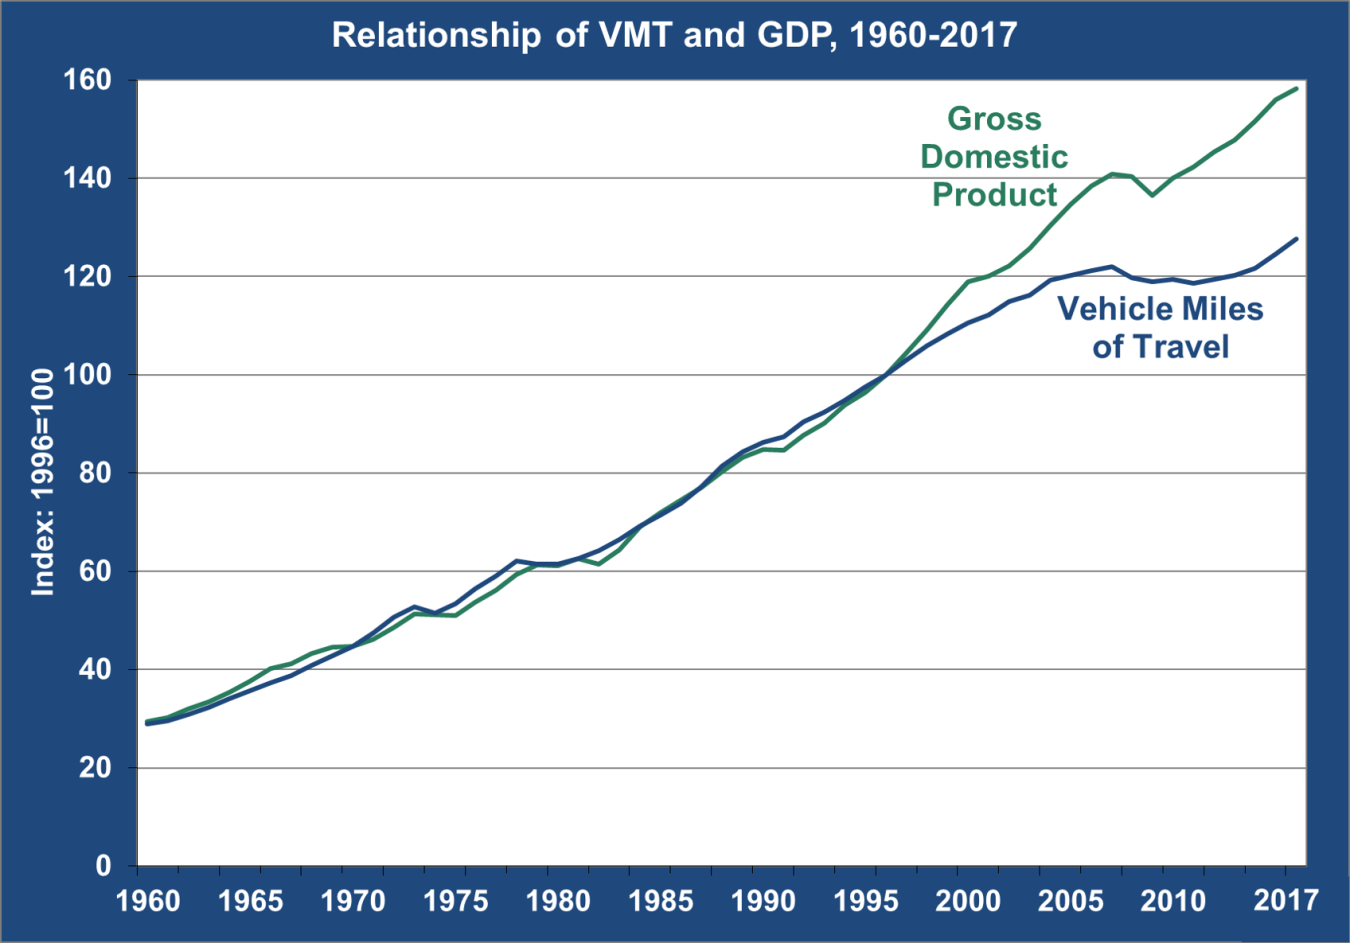
Note: GDP has been adjusted for inflation.
Sources:
GDP: U.S. Bureau of Economic Analysis, National Economic Accounts, Gross Domestic Product website, accessed February 27, 2018.
VMT 1960-2016: U.S. Department of Transportation, Federal Highway Administration, Highway Statistics 2016, Table VM-1 and previous annual editions.
VMT 2017: U.S. Department of Transportation, Federal Highway Administration, Traffic Volume Trends December 2017, p. 2.
Contributing causes: National Center on Sustainable Transportation, "What Affects U.S. Passenger Travel? Current Trends and Future Perspectives," February 2016.