
In 1989, for the first time, the petroleum consumption for transportation surpassed total U.S. petroleum production. By 2015, that had changed.
Transportation Technologies Office
October 23, 2017SUBSCRIBE to the Fact of the Week
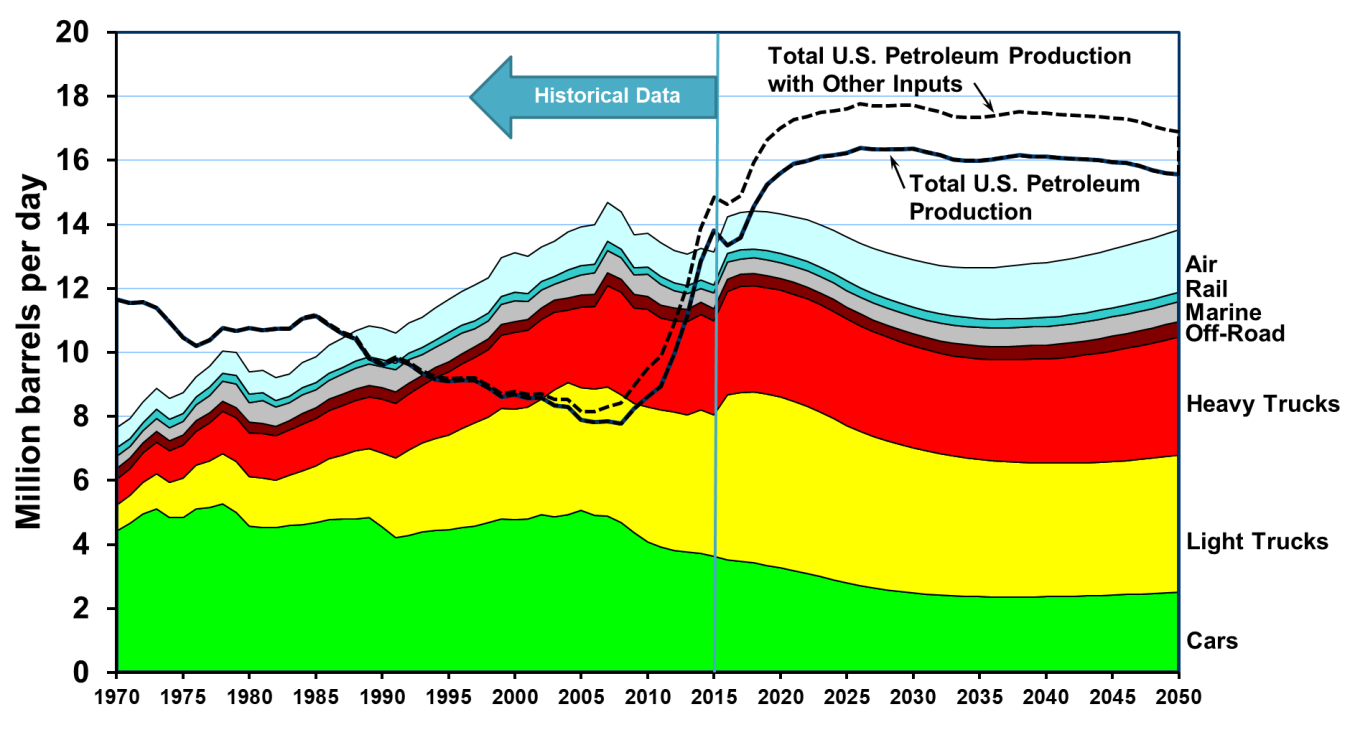
In 1989, for the first time, the petroleum consumption for transportation surpassed total U.S. petroleum production, which was declining. These contrasting trends in production and consumption created a gap that was met with foreign imports of petroleum. In 2009, however, the U.S. production of petroleum (for all uses including, but not limited to, transportation) began to increase substantially because of new hydraulic fracturing and oil extraction technology. In 2015, total production exceeded all transportation sector petroleum consumption. With other inputs included, such as ethanol, domestic production has exceeded transportation consumption since 2014. Transportation accounts for about 70% of all U.S. petroleum consumption.
The Energy Information Administration expects petroleum production to be greater than transportation consumption through 2040. Including non-petroleum sources such as ethanol, the production will exceed transportation demand by about three million barrels per day in 2050.
U.S. Petroleum Production and Transportation Consumption 1970-2050
Notes:
- "Total U.S. Petroleum Production" includes crude oil, natural gas plant liquids, and refinery gains. It does not include dry natural gas.
- "Total U.S. Petroleum Production" is for all uses, including but not limited to transportation.
- "Total U.S. Petroleum Production with Other Inputs" also includes non-petroleum sources such as ethanol, biomass, liquids from coal, other blending components, other hydrocarbons, and ethers which were domestically produced.
- The change from historical values to projected values is between 2015 and 2016.
- The sharp increase in the value for heavy trucks between 2006 and 2007 is the result of the Federal Highway Administration’s methodology change.
Sources:
Historical transportation petroleum use – Oak Ridge National Laboratory, Transportation Energy Data Book: Edition 36, Tables 1.14 and 1.15, forthcoming.
Historical U.S. petroleum production – Energy Information Administration, Monthly Energy Review August 2017, Table 3.1.
Historical other inputs - Energy Information Administration, Monthly Energy Review August 2017, Tables 10.3 and 10.4.
Forecasted petroleum use and petroleum production – Energy Information Administration, 2017 Annual Energy Outlook, January 2017, reference case tables 7, 11, and 36.