
DOE’s work in color and spectrum covers a wide range of issues, including chromaticity, color rendition, physiological effects, and brightness perception. Optimizing the spectrum of electric light sources is critical for addressing visual and non-visual effects while maximizing the benefit delivered per amount of energy used. Improved quality increases consumer acceptance and adoption.
DOE has produced a number of peer-reviewed journal articles related to color and spectrum, which are listed below.
COLOR AND SPECTRUM RESEARCH
Correlated color temperature (CCT) is one of the primary metrics used to characterize the visual appearance of light and is most informative when coupled with distance from the Planckian locus (Duv). Given a set of chromaticity coordinates—which are calculated from a light source’s spectral power distribution—it is possible to compute CCT and Duv with varying levels of accuracy. Over the last six decades at least a dozen methods have been proposed to compute CCT while balancing accuracy with calculation complexity. CCT values become inconsistent at some level of precision when calculated using different methods, which in turn can lead to discrepancies in dependent or subsequent calculations used by lighting professionals and may be problematic in software. Although methods are now documented that can provide extremely high accuracy, no consensus body has recommended a preferred method. This analysis examines both the calculation speed and the CCT and Duv accuracy of previously proposed and new methods. With consideration of the calculation accuracy, computational burden, calculation complexity, and considerations of practical implementation, we recommend a recent modification of the Robertson method.
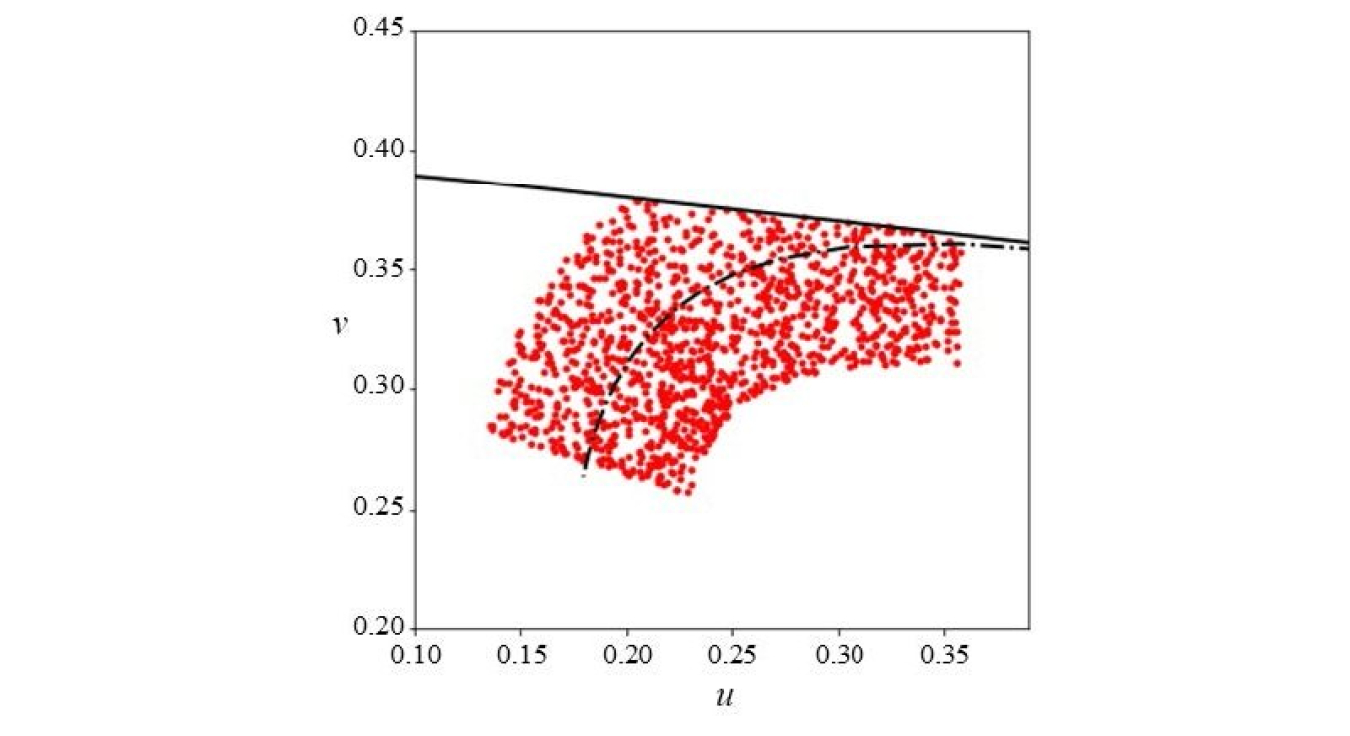
CIE 1960 UCS coordinates of the reference set (1,270 points).
(May 2023, Lighting Research & Technology)
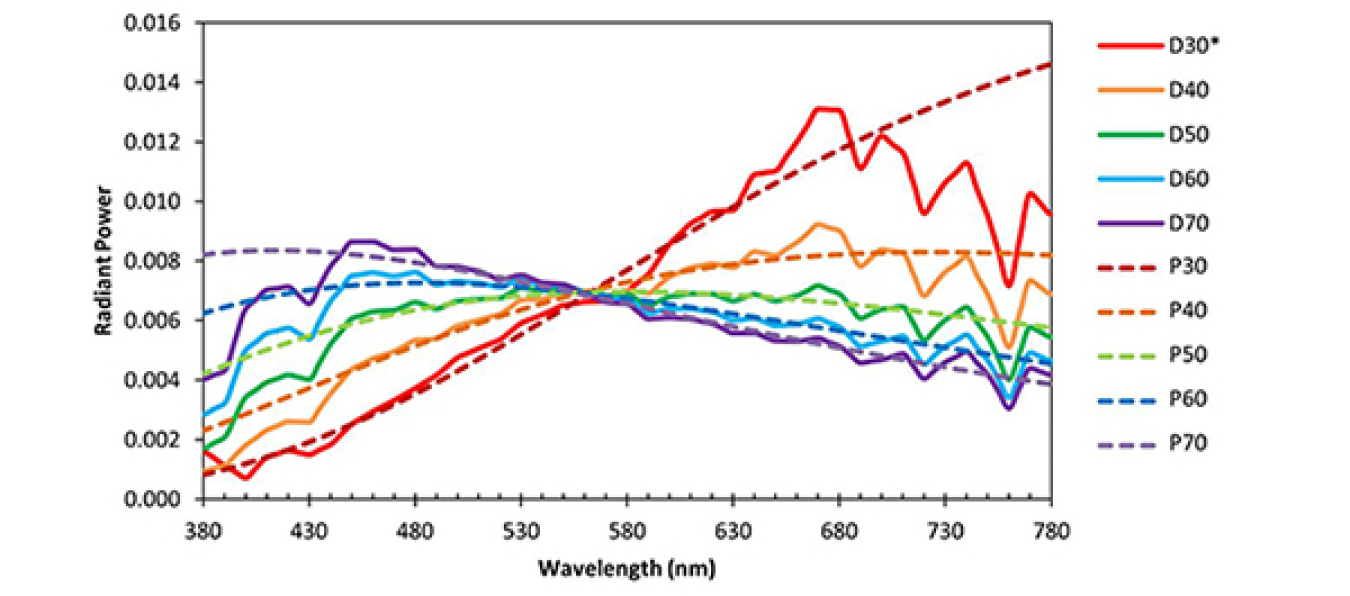
Multi-primary tunable LED lighting systems can generate a vast number of spectral outputs, with the exact number depending on the resolution of the control signal and number of LED primaries. Computing all combinations to identify optimal spectral power distributions (SPDs) with a specified chromaticity would require a tremendous amount of time and computational power. Here, an enumeration reduction (ER) algorithm is described to reduce the computation time by defining a bounding pyramid in the three-dimensional tristimulus space that maps to the circumscribed square of the target region in the chromaticity diagram. This method enables computing only the necessary amount of tristimulus values (and resulting chromaticity coordinates) for SPDs that fall into a user-defined target chromaticity area, reducing computation time by avoiding the need to generate each combination and calculate its chromaticity coordinates. The results show that the proposed ER algorithm can greatly reduce the time – up to 922 times in a series of tests – to determine a set of metamers compared to a full enumeration computation.
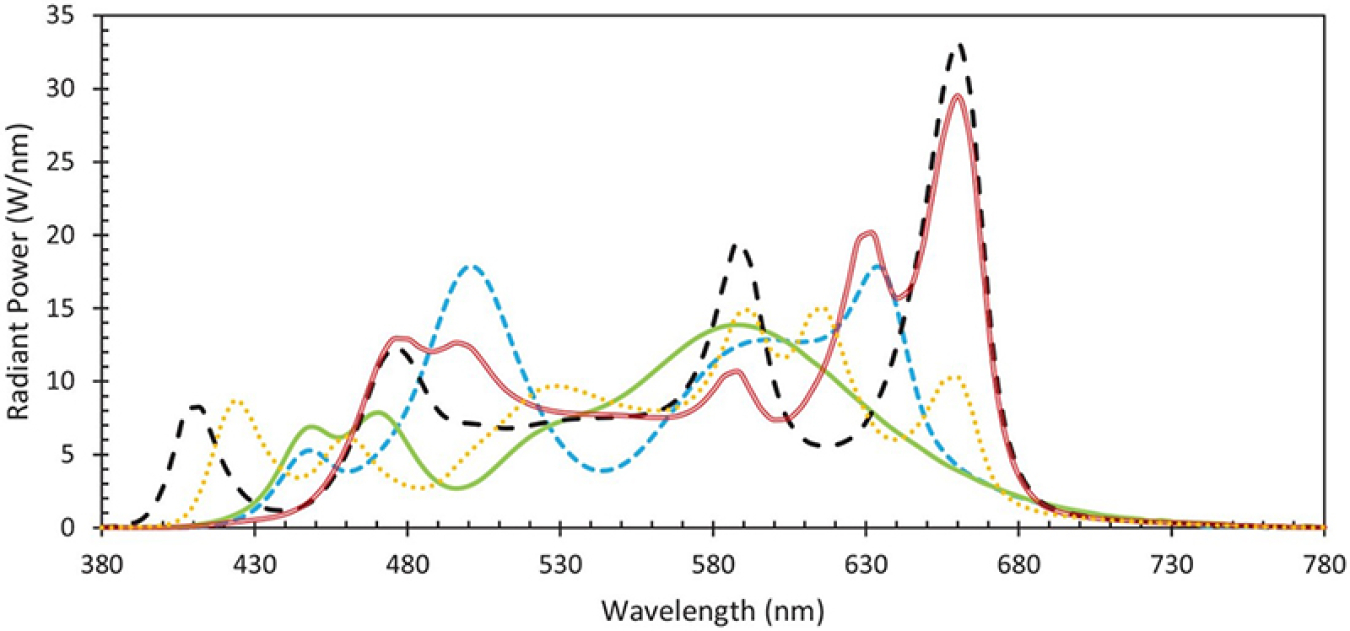 Demonstration of different spectral power distributions of lights, each represented by a different line type, having identical chromaticity (3500 K on the Planckian locus) that could be generated by a multi-primary LED system.
Correlated color temperature (CCT) is one of the principal metrics used in the engineering and specification of lighting. One of the most common methods used for calculating CCT was first proposed by Robertson in 1968. It utilizes a 31-row lookup table (LUT) based on isotemperature lines and a formula to interpolate CCT values between the lines. The original Robertson method is known to have modest errors in determining CCT, so many alternative methods demonstrating improved accuracy have been subsequently proposed. Rather than an entirely new method, this analysis proposes three changes to the original Robertson method: recalculation of the LUT with an increase in the resolution to an increment of 1%, a correction to address CCT errors in the region between isotherms with slopes of opposite sign, and the application of a Fibonacci or binary search algorithm to efficiently search the expanded LUT. These changes result in a CCT calculation method, denoted Robertson2022, that produces CCT errors less than 0.1 K throughout the range of 1,500 K to 40,000 K with Duv between -0.05 and 0.05.
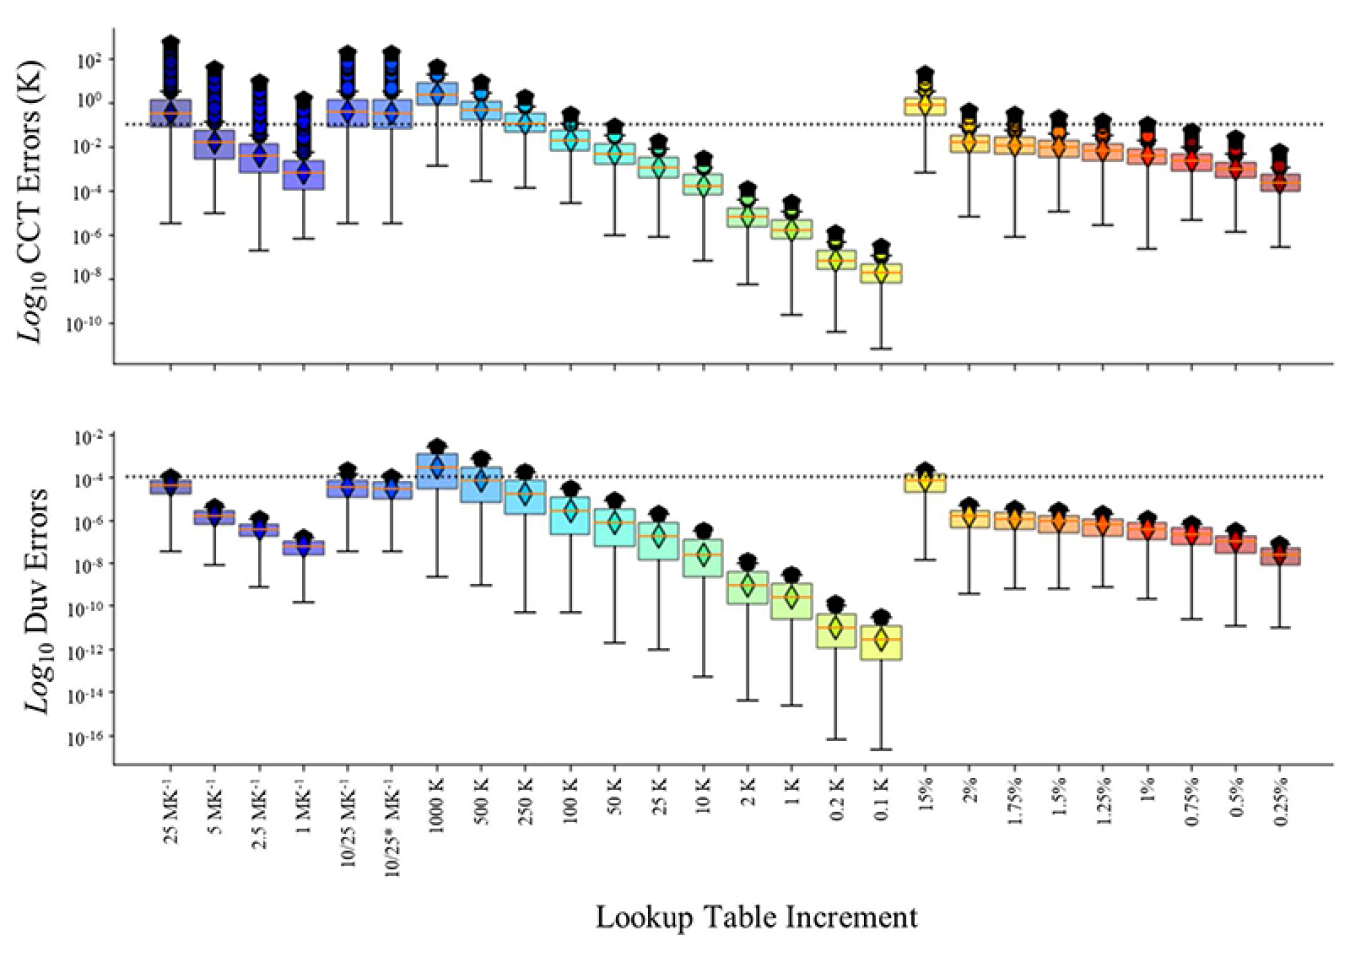
Boxplots of the CCT and Duv errors for the Robertson method (with slope correction) using different LUTs. Increment 10/25 denotes the original LUT and 10/25* denotes the extended original LUT. The error thresholds for CCT (0.1 K) and Duv (0.0001) are indicated by the dotted line in each chart.
(May 2022, Building and Environment)
This paper describes a framework and provides a computational tool to characterize the color quality and biological potential of light that is transmitted through glass and other optical materials. The IES TM-30 framework and Excel computation tool were adapted to evaluate color quality, with measures from CIE S 026, UL 24480, and the WELL Building Standard v2 added to evaluate biological potential. The user selects a pre-transmittance spectral power distribution (SPD), such as for a CIE D-Series Illuminant, Planckian radiation, electric lamp, or measurement of daylight at a building site. The tool allows a user to populate a database with spectral data for glazing or other optical materials, comprising spectral transmission and the spectral reflectance of both sides. The user creates a unit with one, two, or three panes of glazing or other optical materials, and the tool calculates the composite spectral transmittance accounting for reflections between materials. The tool computes the transmitted SPD, then determines colorimetric and photobiological outputs using the transmitted SPD as the test source. Glass, window, and skylight manufacturers can employ the tool to optimize glazing spectral transmission to achieve intentional colorimetric and photobiological performance with transmitted light. Electric lighting manufacturers, designers, and researchers can use the tool to evaluate the impact of glazing units and other optical materials on the color quality and biological potential of transmitted light.
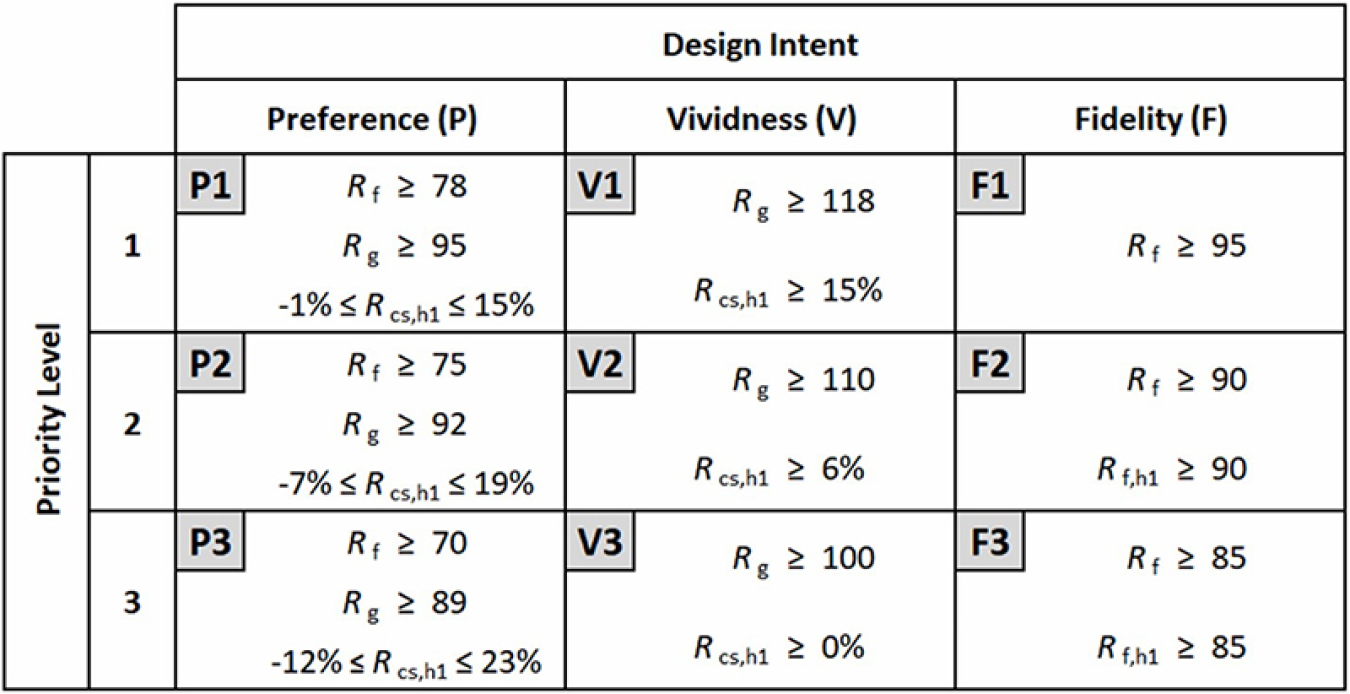
Recommended specification criteria based on design intent (columns) and priority level (rows) from ANSI/IES TM-30-20 Annex E. All criteria assume a polychromatic environment with average horizontal illuminance between 200 and 700 lx and uniform chromaticity. They are not limited to a specific application, culture, or CCT.
Illuminant-induced metameric mismatch is an important consideration in the specification of light sources for some architectural environments, yet there is currently no standardized performance measure. The goal of this work was to evaluate two recent research proposals: the metameric uncertainty index (Rt) and the metamer mismatching color rendering index (MMCRI). To compare the relative performance of these two measures, 100,000 spectral power distributions were generated with 3, 4, 5, 6, and 7 Gaussian spectral components and spectral widths varying from 1 nm (monochromatic) to 100 nm. Both measures generally agree with the theory that broadband radiation should cause less metameric mismatch than narrowband radiation. The two measures have relatively better agreement for broadband SPDs and relatively worse agreement for narrower spectra. Despite some similarities, non-parametric statistical tests suggest that Rt and MMCRI are significantly different quantifications of illuminant-induced metameric mismatch (p < 0.0001 for all comparisons). Characteristics of the MMCRI computation that are potentially problematic for applied lighting were observed.
![Chart showing spectral reflectance functions of the square type used in the computation of MMCRI, with “Wavelength [nm] on the x-axis and “Reflectance (%)” on the y-axis.](/sites/default/files/styles/full_article_width/public/2023-09/5-Measures%20of%20illuminant-induced%20metameric%20mismatch.jpg?itok=SdaaK83m)
Spectral reflectance functions of the square type used in the computation of MMCRI. Two separate functions are shown: one with a solid black line and another with a grey dashed line. Each has five transition wavelengths, where the reflectance function transitions between 0 (0% reflectance) and 1 (100% reflectance).
This article describes a method for calculating and specifying light source chromaticity using the International Commission on Illumination (CIE) 2015 10° color matching functions (CMFs), which, according to analysis of existing psychophysical experiment data, can reduce visual mismatch compared to specifications based on the traditional CIE 1931 2° CMFs in architectural lighting applications. Specifically, this work evaluates, documents, and recommends for adoption by lighting standards organizations a supporting system of measures to be used with the CIE 2015 10° CMFs: a new uniform chromaticity scale (UCS) diagram with coordinates (s, t), a measure of correlated color temperature (CCT), and a measure of distance from the Planckian locus (Dst). It also presents options for updating nominal classification quadrangles. A complete method of this nature has not yet been standardized, which may be contributing to the slow uptake of the CIE 2015 CMFs.
The proposed tools are analogous to u, v, CCT, Duv, and the American National Standards Institute (ANSI) C78.377 chromaticity specifications that are all currently defined in the CIE 1960 UCS diagram using the CIE 1931 2° CMFs. While conceptually equivalent, the differences between the current standard method and the proposed st system are important for reducing unintended visual mismatch in the chromaticity of light. The implications of changing chromaticity specification methods are identified by a comparison over a diverse set of real light source spectral power distributions.
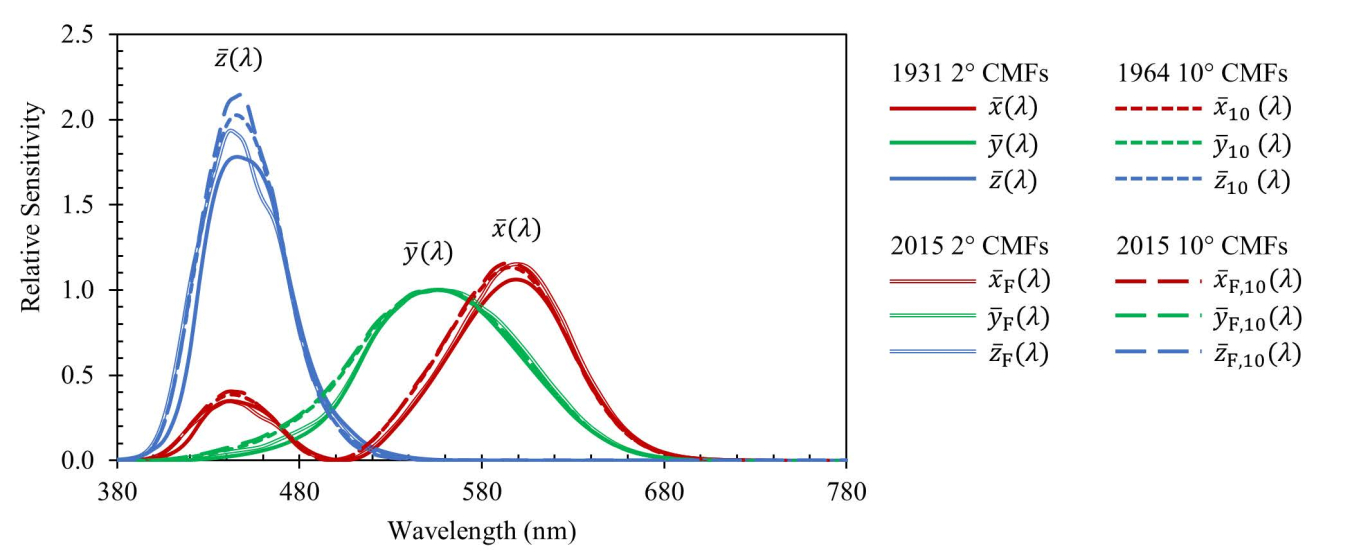 Comparison of four CMF sets standardized by the CIE. The discrepancy is largest at the short wavelengths side of each function.
(June 2021, Lighting Research & Technology)
This article explores best practices for conducting psychophysical experiments that investigate how colour rendition influences the perception of architectural environments. We offer guidance that covers all stages of research from preliminary development to publication, focusing especially on experiments that investigate qualities such as perceived naturalness, vividness, preference, or acceptability in response to changes in the spectral power distribution (SPD) of light sources. This article is intended to be a consolidated guide for researchers and reviewers of this type of research. Key recommendations include: 1) New work should be motivated by clearly expressed research questions and, when possible, explicit hypotheses that build on the existing body of knowledge, 2) Visual stimuli comprising SPDs and visual targets should be deliberately engineered to probe the research questions, 3) Experiments should be designed to lessen potential biases, 4) Reporting of experimental conditions and statistical analyses should be thorough, and 5) Results should be contextual, resisting overgeneralization that cannot be supported by the data. Our motivation is to encourage high quality research that is credible and discourage poor quality research that slows scientific progress and misuses resources.
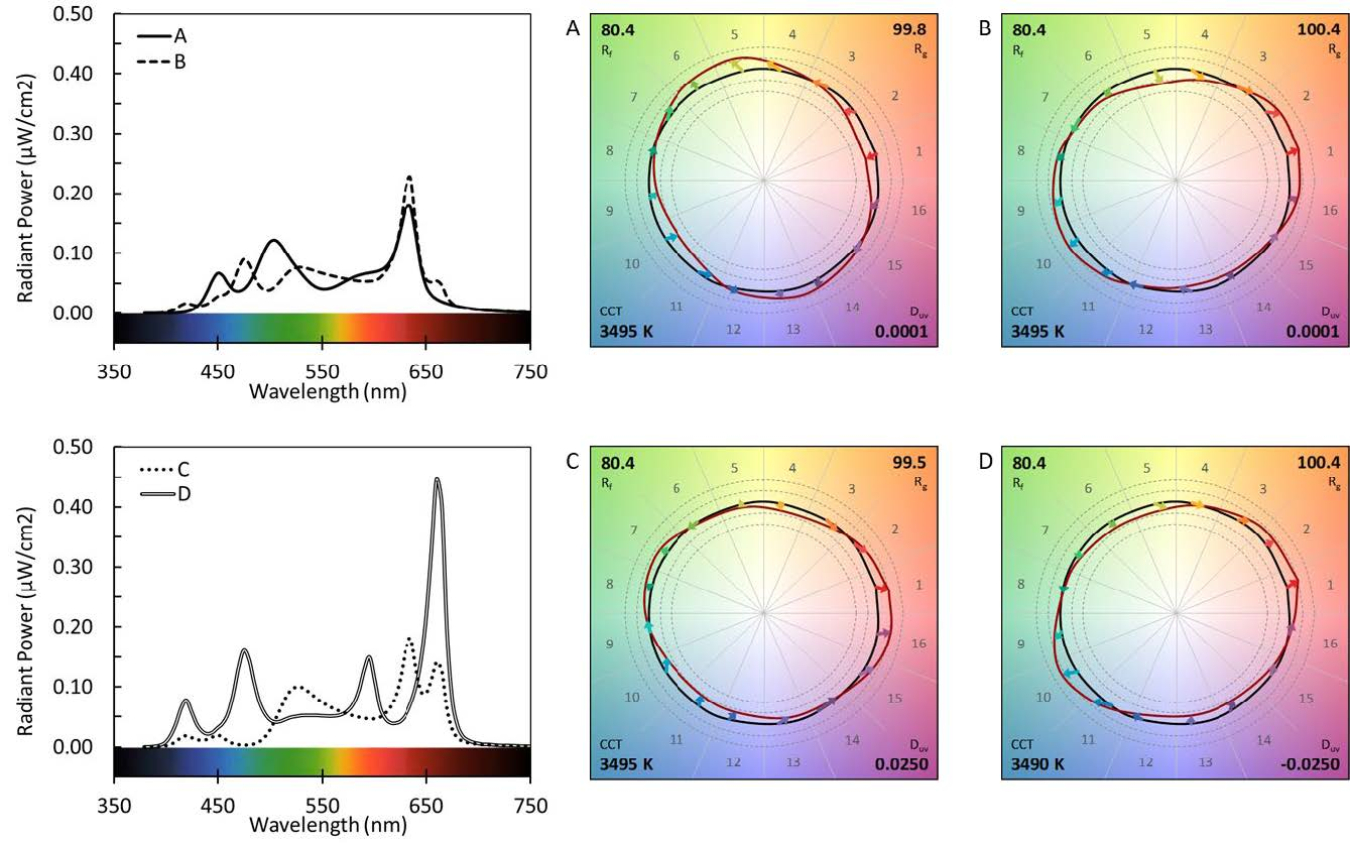 Four SPDs that are nearly identical on some spectrally derived quantities while being substantially different on other spectrally derived quantities, illustrating the exquisite care that is needed to operationalize SPD using derived measures.
This tutorial article provides a comprehensive overview of the development and use of ANSI/IES TM-30-20, an American National Standard method for evaluating light source color rendition that is published by the Illuminating Engineering Society. Five years since its initial publication, TM-30 is increasingly used by lighting producers, specifiers, and researchers due to its superior accuracy and the expanded scope of provided information compared to predecessor tools for assessing color rendition. Making the most of these improvements requires people who use the method to be more knowledgeable and intentional, and this tutorial consolidates a range of information to assist with best practices. The article, arranged as a series of questions, includes information about the development of the standard, color rendering fundamentals, TM-30 measures and their meaning, TM-30 calculation details, and application of TM-30. The document does not provide instructions for performing TM-30 calculations, which is the purpose of the ANSI/IES TM-30-20 standard, which is freely available.
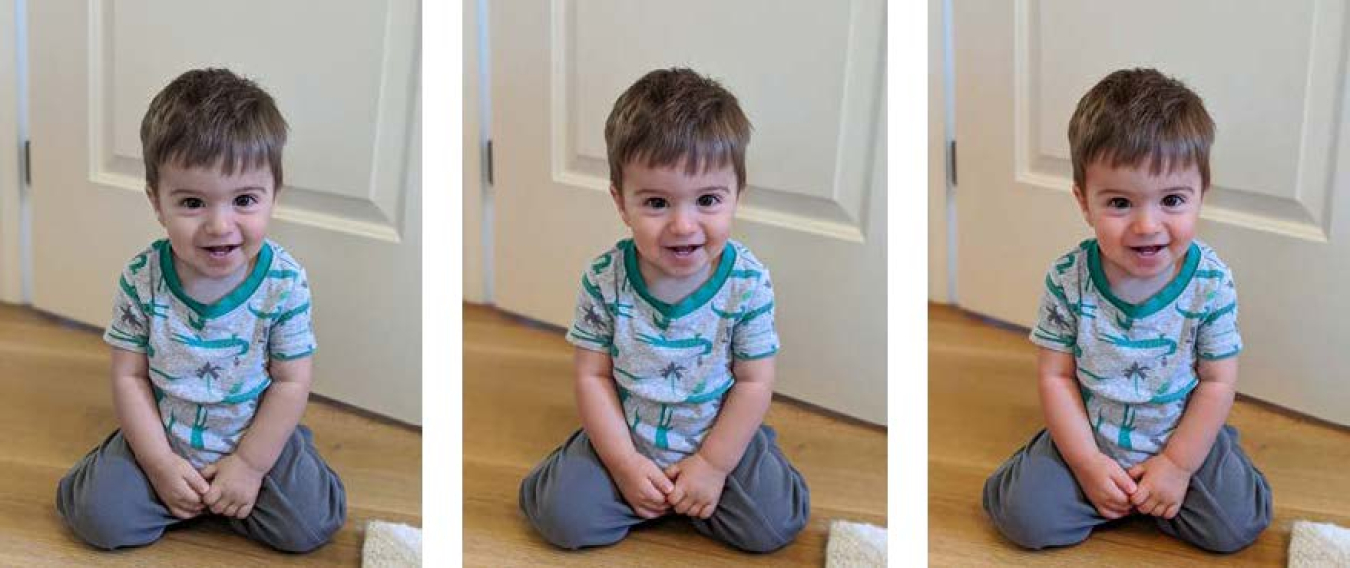 Theoretical illustration of the effect of color rendition on human complexion. Variations in wood tone are also notable.
Color rendition and energy efficiency have long been considered characteristics of light sources that cannot be maximized simultaneously. The tradeoff has been studied extensively, but usually considering only average color fidelity. This work examines the color rendition versus energy efficiency tradeoff in the context of ANSI/IES TM-30-18, Method for Evaluating Light Source Color Rendition, which provides numerous measures beyond average color fidelity. The analysis demonstrates that color rendition criteria based on combinations of ANSI/IES TM-30-18 values can be used to improve color quality with less of an effect on luminous efficacy of radiation than increasing CIE Ra alone.
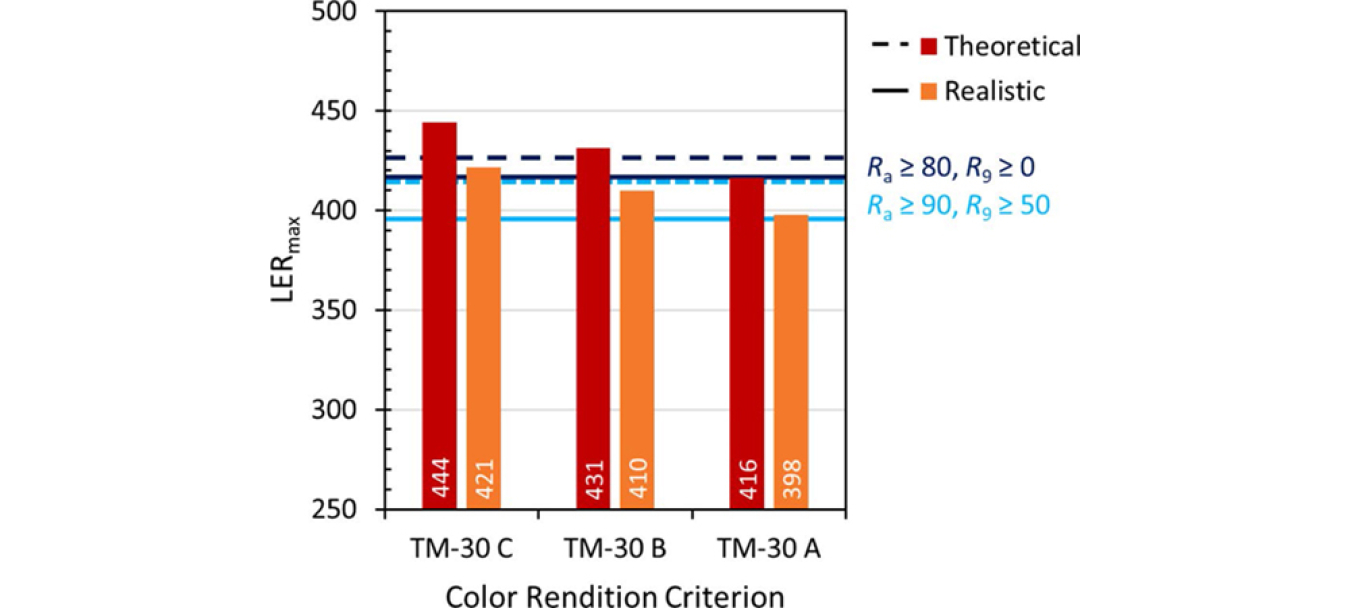
Maximum LER achieved in the theoretical and realistic scenarios with TM-30 based color rendition criteria.
(June 2019, Proceedings of the 29th CIE Session)
This article examines the relationship between various attributes of light source spectral power distributions (SPDs) and a recently proposed measure of colour rendition, the Metameric Uncertainty Index (Rt). For SPDs comprised of discrete spectral emissions (primaries), the maximum achievable Rt value (corresponding to a reduced likelihood of metameric mismatch) increases with both the number of primaries and their bandwidth. This work also explores how Rt relates to and interacts with other measures of colour rendition—in particular, the Fidelity Index (Rf)—and luminous efficacy of radiation (k). This is important, because there is an intrinsic tradeoff between luminous efficacy of radiation and colour rendition, which informs the application-dependent optimization of illumination. When white-light SPDs are engineered to maximize k, subject to maintaining a minimum required Rf value, the result is a small number of narrow primaries and hence a comparatively poor Rt value. This can only be mitigated by including Rt among the colour rendition optimization constraints. Therefore, from this perspective, Rt is an independent and key aspect of colour rendition.
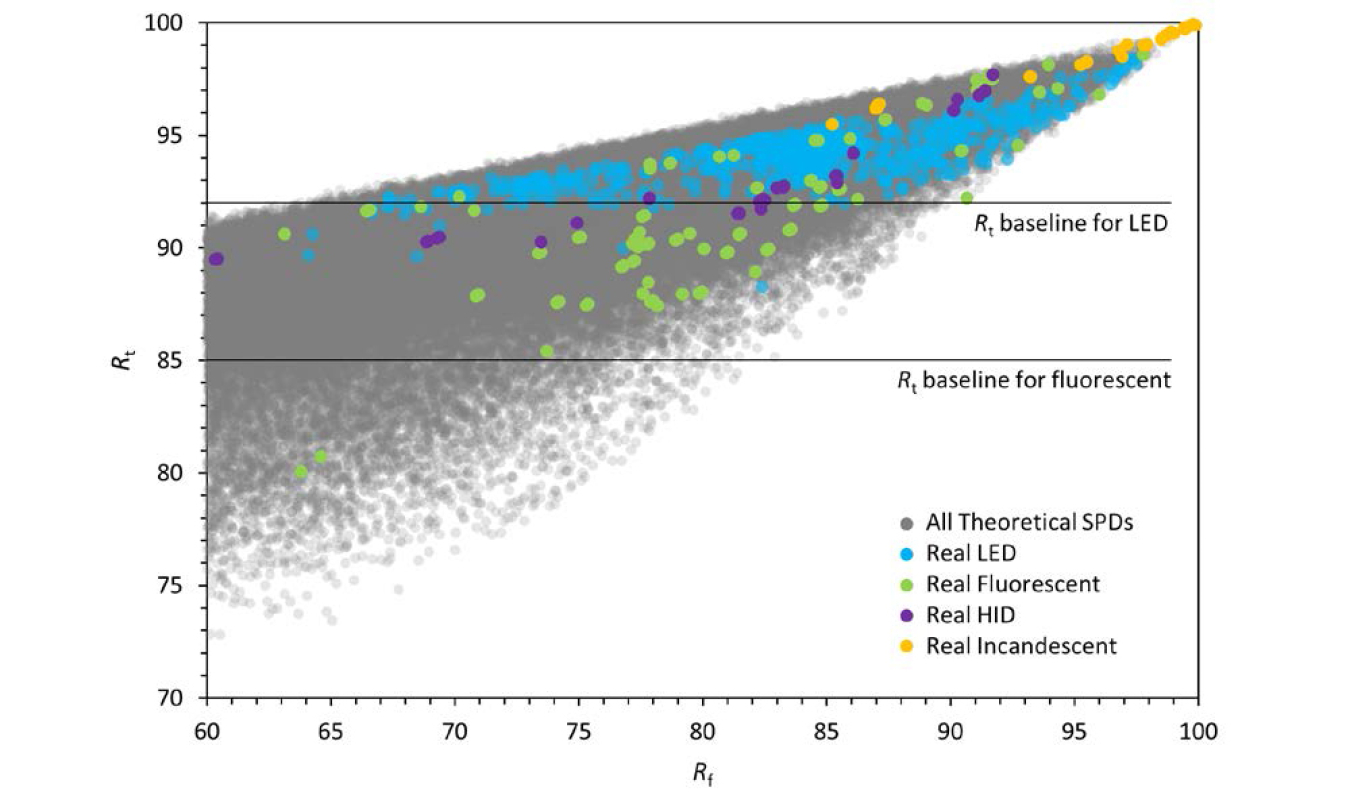
Rt vs Rf for theoretical and real SPDs, with newly established baselines.
(June 2019, Lighting Research & Technology)
An experiment was conducted to examine colour rendition specification criteria. Twenty-five participants each evaluated 90 lighting scenes in a room filled with objects. The lighting scenes included nine chromaticity groups, each with 10 systematically-varied colour rendition conditions designed to meet or not meet previously proposed colour preference specification criteria using ANSI/IES TM-30-18 Rf, Rcs,h1, and Rg. The colour rendition conditions did not meet the criterion for none, one, two, or all three of these measures. Participants, who chromatically adapted to each chromaticity group, rated the objects’ colour appearance on eight-point scales for saturated-dull, normal-shifted, and like-dislike (preference), as well as a binary for acceptable or unacceptable. The findings corroborate past work, but also indicate that colour preference criteria could be adjusted slightly to improve performance, with Tier A having Rf ≥ 78, Rg ≥ 95, and -1% ≤ Rcs,h1 ≤ 15%, Tier B having Rf ≥ 74, Rg ≥ 92, and -7% ≤ Rcs,h1 ≤ 19%, and Tier C having Rf ≥ 70, Rg ≥ 89, -12% ≤ Rcs,h1 ≤ 23%. A companion regression analysis shows models based on Rf, Rg, and Rcs,h1 were superior in predicting colour preference compared to those using other measures of colour rendition.
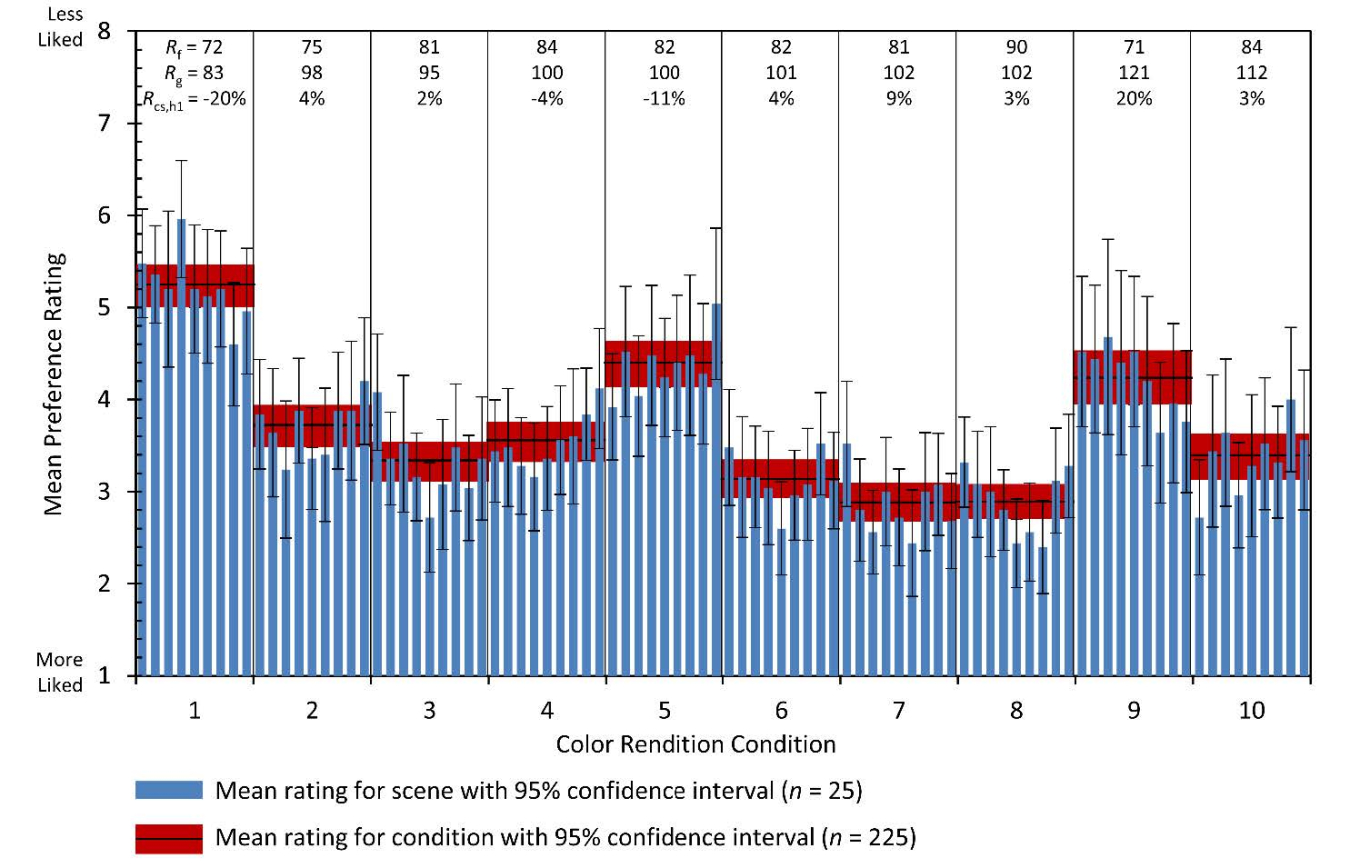 Mean preference rating for each of the 90 scenes grouped by color rendition condition.
(March 2019, Light-Emitting Devices, Materials, and Applications)
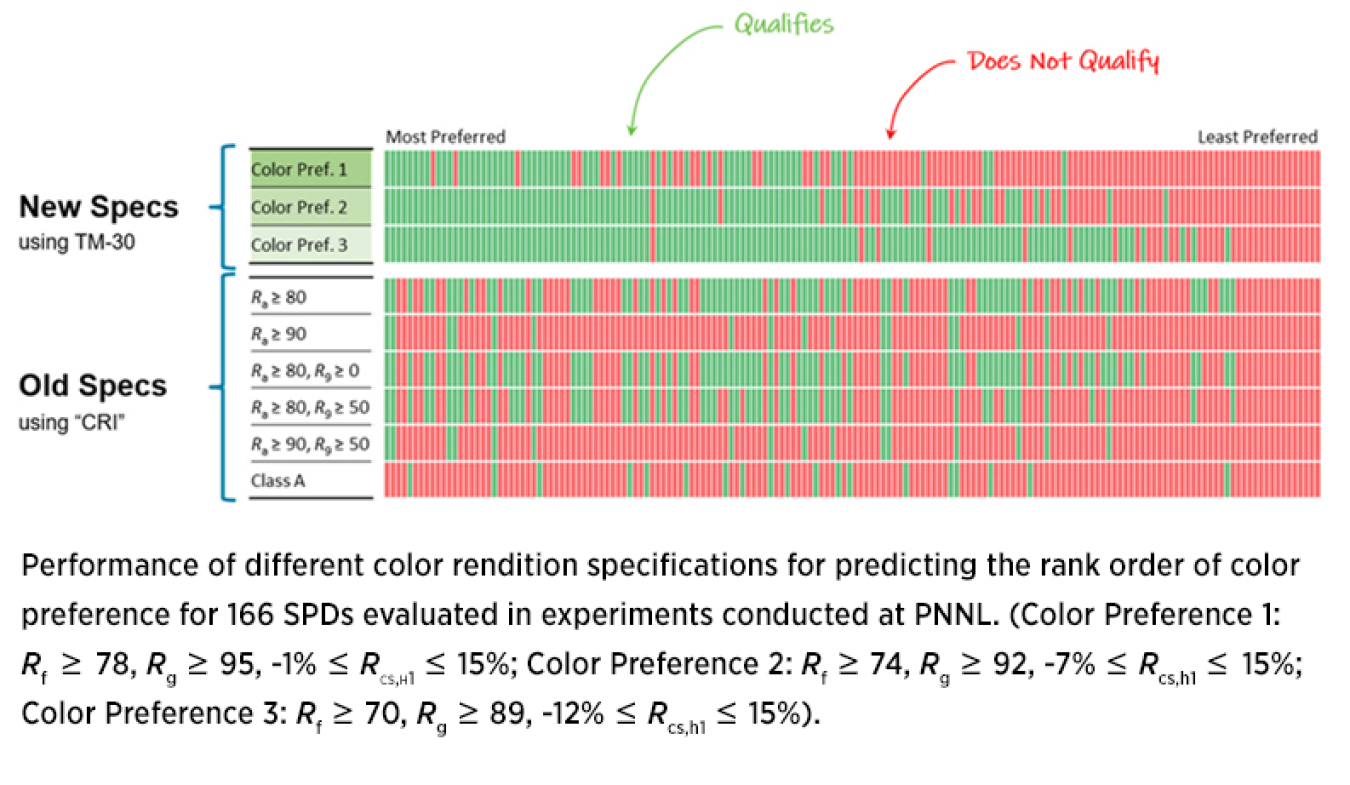
Methods for evaluating light source color rendition have recently undergone substantial changes. This article explores the ability of color rendition specification criteria to capture preferences for lighting color quality. For a compilation of five recent psychophysical studies on perceptions of colors, recently proposed specification criteria using ANSI/IES TM-30-18 substantially outperformed all currently used specification criteria in identifying preferred lighting conditions. To understand the consequences of changing color rendition specification criteria, the performance of a set of 484 commercially-available SPDs was evaluated.
This article describes a way to distinguish between two distinct components of light-source-induced color shifts, base color shift and metameric color shift, to provide a more complete understanding of color rendition. Working within the existing framework of IES TM-30-18 and CIE 224:2017, it shows that base color shift varies smoothly with location in color space in a pattern that is determined by the SPD of the light source. Patterns of smooth variation can often be approximated well with a low-order polynomial function. Here, a vector field model is presented, based on a second order polynomial function. The polynomial coefficients are adjusted, for a given light source, to provide a least squares fit to the calculated color shifts of a standard set of color samples. The adequacy of this model was verified by comparing it to another approach for characterizing base color shift that is based on discretization of color space and a much larger set of color samples. Once the vector field model of base color shifts for a given light source is determined, the metameric color shifts can be calculated from the residuals, and the distribution of those shifts can be statistically summarized. Based on this information, a Metameric Uncertainty Index (Rt) is proposed to provide new information about a light source. In particular, it can be used to estimate the likelihood of noticeable metameric mismatches induced by a given light source, which could lead to improved predictions of the perceived color quality of light.

(a) Correlation between Rf and Rt for the large SPD set. (b) Examples of two SPDs having a same value of Rf , but different values of Rt. (c) and (d) show corresponding vector field maps for these SPDs.
This article examines how the color sample set, color space, and other calculation elements influence the quantification of gamut area. The IES TM-30-18 Gamut Index (Rg) serves as a baseline, with comparisons made to several other measures documented in scientific literature and 12 new measures formulated for this analysis using various components of existing measures. The results demonstrate that changes in the color sample set, color space, and calculation procedure can all lead to substantial differences in light source performance characterizations.
It is impossible to determine the relative “accuracy” of any given measure outright, because gamut area is not directly correlated with any subjective quality of an illuminated environment. However, the utility of different approaches was considered based on the merits of individual components of the gamut area calculation and based on the ability of a measure to provide useful information within a complete system for evaluating color rendition. For gamut area measures, it is important to have a reasonably uniform distribution of color samples (or averaged coordinates) across hue angle—avoiding exclusive use of high-chroma samples—with sufficient quantity to ensure robustness but enough difference to avoid incidents of the hue-angle order of the samples varying between the test and reference conditions. It is also important to use a modern, uniform color space that is suitable for the quantification of color appearance and color difference.
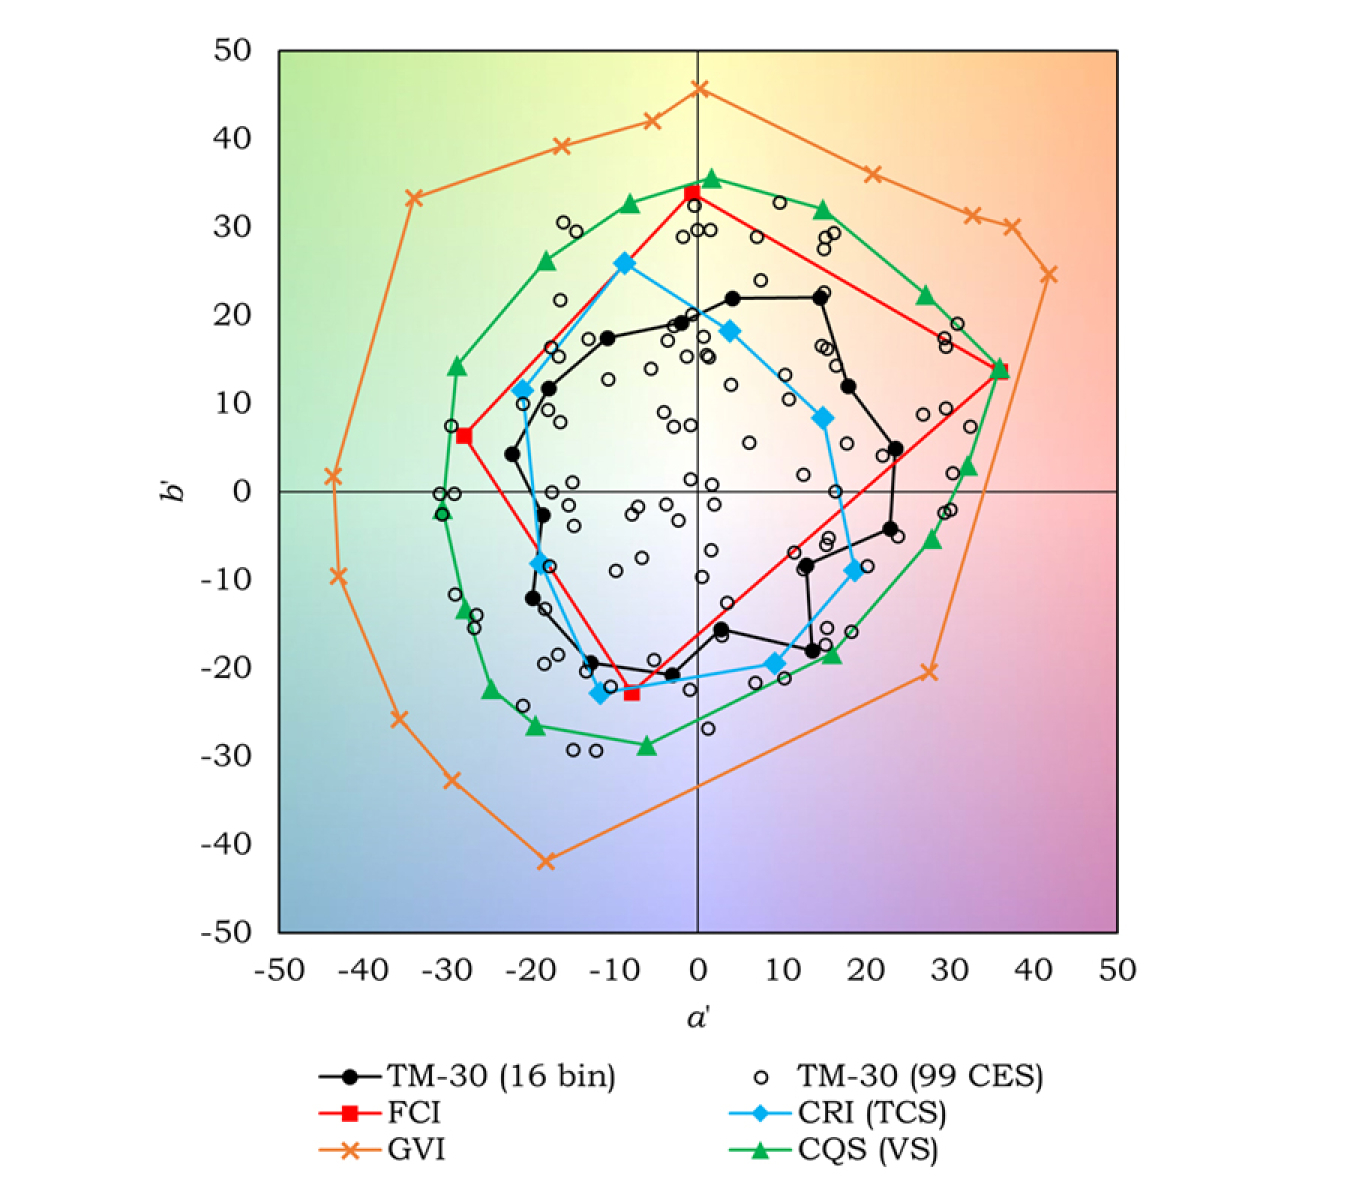 Comparison of (a', b') CAM02-UCS coordinates for five color sample sets. The illuminant is CIE D50.
The introduction of new measures of color rendition, especially IES TM-30-15, has stirred debate within the lighting industry on the relative merits of the tools, as well as the amount of difference between the new tools and prior tools, such as CIE Ra. This article focuses on comparing three measures of average color fidelity: IES Rf, CIE Ra, and CIE Rf. Using a large set of commercially-available, experimental, and theoretical spectral power distributions (SPDs), the analysis contrasts past efforts to make similar comparisons using smaller or more focused datasets. It highlights the interactive effect of gamut shape and color space non-uniformity, which results in a range of IES Rf values of at least to 50 to 86 for SPDs having a CIE Ra value of 80. It also examines how these differences can be overlooked in psychophysical experiments relying on a small number of SPDs, which can present misleading findings on the value and meaning of the measures. When considering the results, it is important to remember that average color fidelity is only one aspect of color rendition.
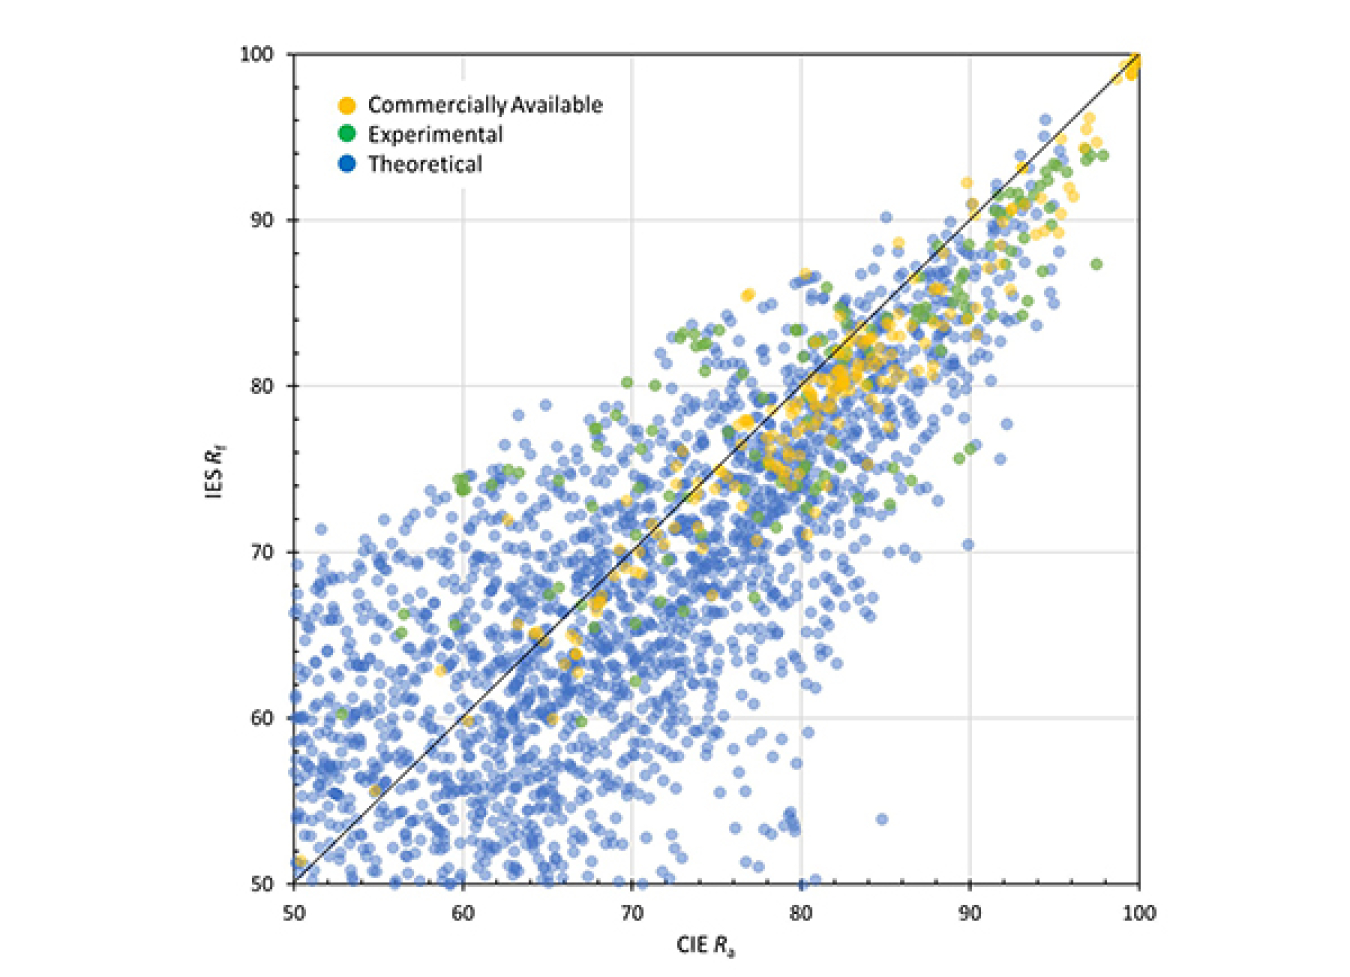 Comparison of CIE Rf and CIE Ra for the large SPD set, showing only data points where both measures are greater than or equal to 50. This includes 2,303 SPDs (203 commercial, 136 experimental, 1,964 theoretical).
Though sometimes referred to as a two-measure system for evaluating color rendition, IES TM-30-15 includes key components that go beyond the two high-level average values, Fidelity Index (IES Rf) and Gamut Index (IES Rg). This article focuses on the Color Vector Graphic and Local Chroma Shift (IES Rcs,hj), discussing the calculation methods for these evaluation tools and providing context for the interpretation of the values. We illustrate why and how the Color Vector Graphic and Local Chroma Shift values capture information about color rendition that is impossible to describe with average measures (such as CIE Ra, IES Rf, or IES Rg), but that is pertinent to more completely quantifying color rendition, and to understanding human evaluations of color quality in the built environment. We also present alternatives for quantifying the Color Vector Graphic and Local Chroma Shift values, which can inform the development of future measures.
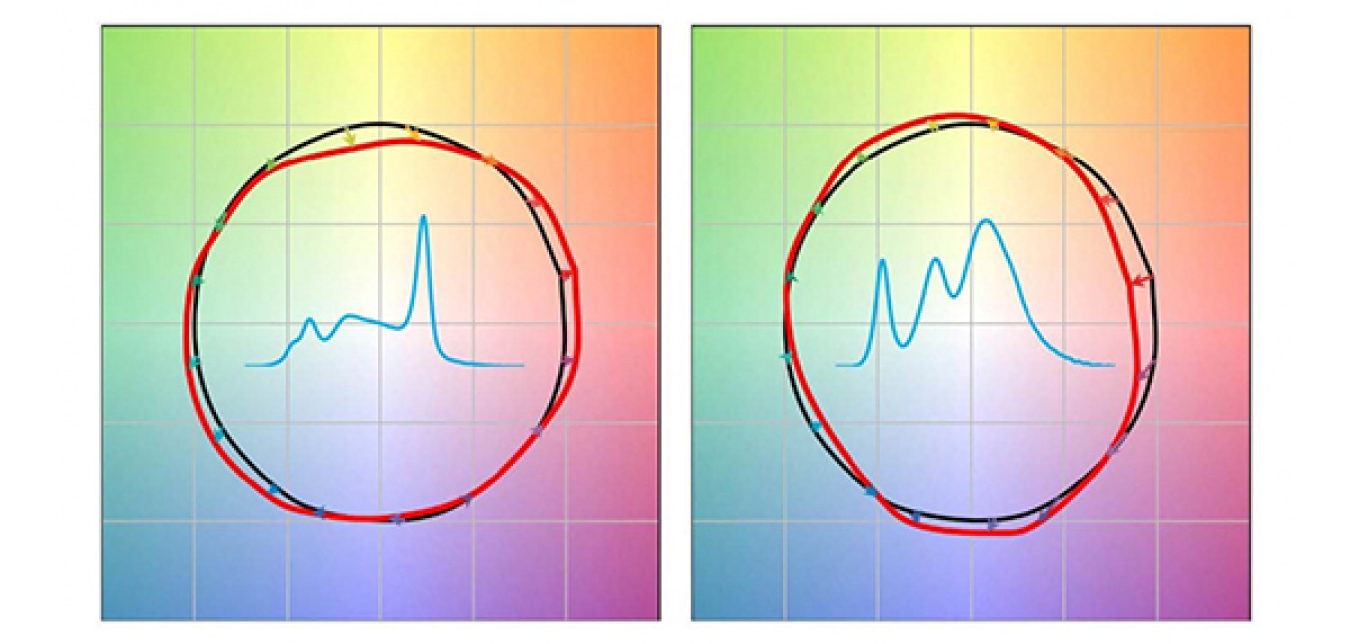 IES TM-30-15 Color Vector Graphics for two light sources with spectral power distributions added to the center of each graphic.
(August 2017, Lighting Research & Technology)
An experiment was conducted to evaluate how perceptions of a light source’s color quality depend upon color rendition and chromaticity. Thirty-four participants each evaluated 50 lighting scenes in a 3.7 m by 5.5 m room filled with objects. The lighting scenes included five chromaticity groups, with 10 systematically-varied color rendition conditions repeated in each group. Participants, who chromatically adapted to each chromaticity group, were asked to rate each scene on eight point scales for saturated-dull, normal-shifted, and like-dislike (preference), as well as choosing whether they found the scenes to be acceptable or unacceptable.
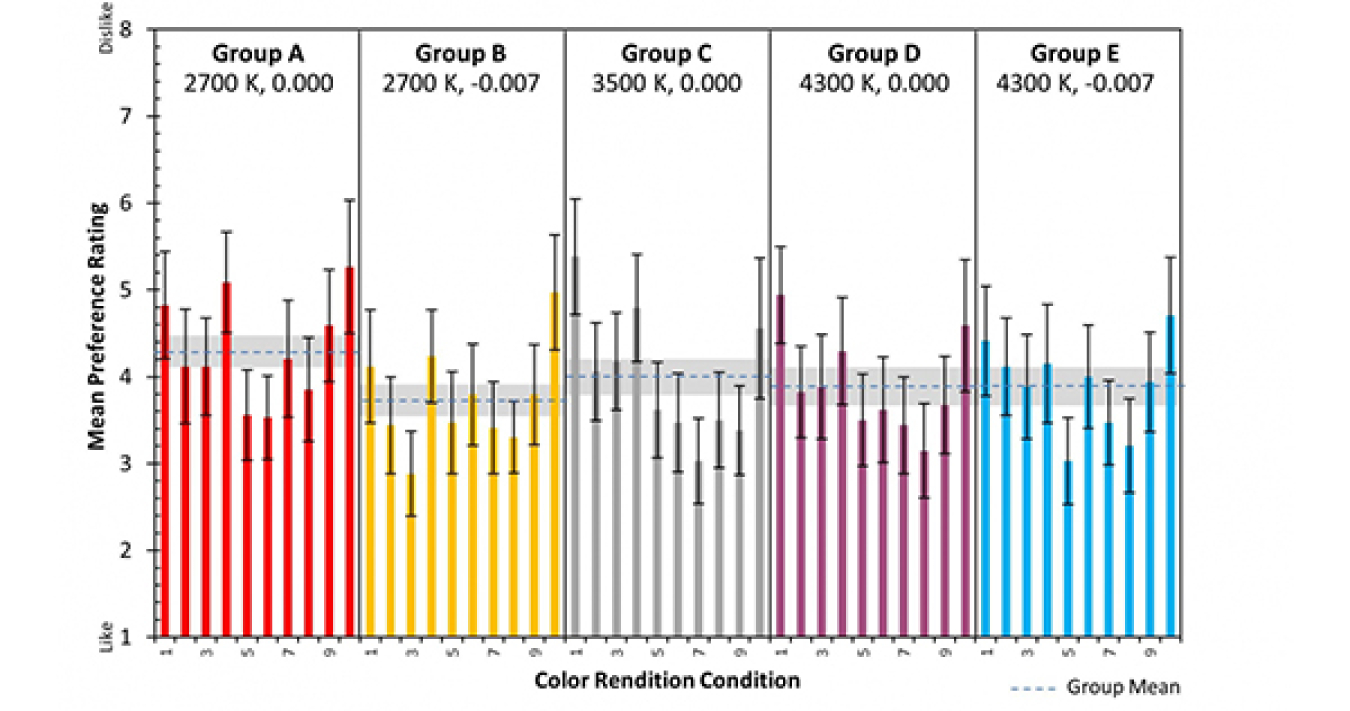
Mean preference ratings for each of the color rendition conditions, and the mean preference ratings for all conditions in each chromaticity group.
The findings suggest that color rendition perceptions can vary with chromaticity, with an interactive effect of CCT and Duv. The same IES TM-30-15 measures—Rf, Rcs,h16, and Rg—could be used to effectively model perceptions within each chromaticity group, and provided suitable performance for the overall set of 50 conditions. The differences in ratings between the chromaticity groups were substantially smaller than the range in ratings for the 10 color rendition conditions within each group, allowing the same acceptability-based criteria of IES Rf ≥ 75, IES Rg ≥ 98, and -7% ≤ IES Rcs,h16 ≤ 15% to be applied to all chromaticity groups.
Although it is a critical component of any measure of color rendition, a standardized set of color samples can seldom perfectly match a real space or a real set of observed objects. This means there will always be some level of mismatch between predicted and observed color shifts. This article explores how the color distortions of three object sets that could be used in experiments compare to the color distortions predicted using the color evaluation samples of TM-30. The experimental object sets include those from a recent experiment, a set of produce (10 fruits and vegetables), and the X-Rite ColorChecker Classic. Specifiers should carefully consider how average measures of color rendition are applied to real spaces, and experimenters should carefully select experimental objects to avoid mischaracterizations.
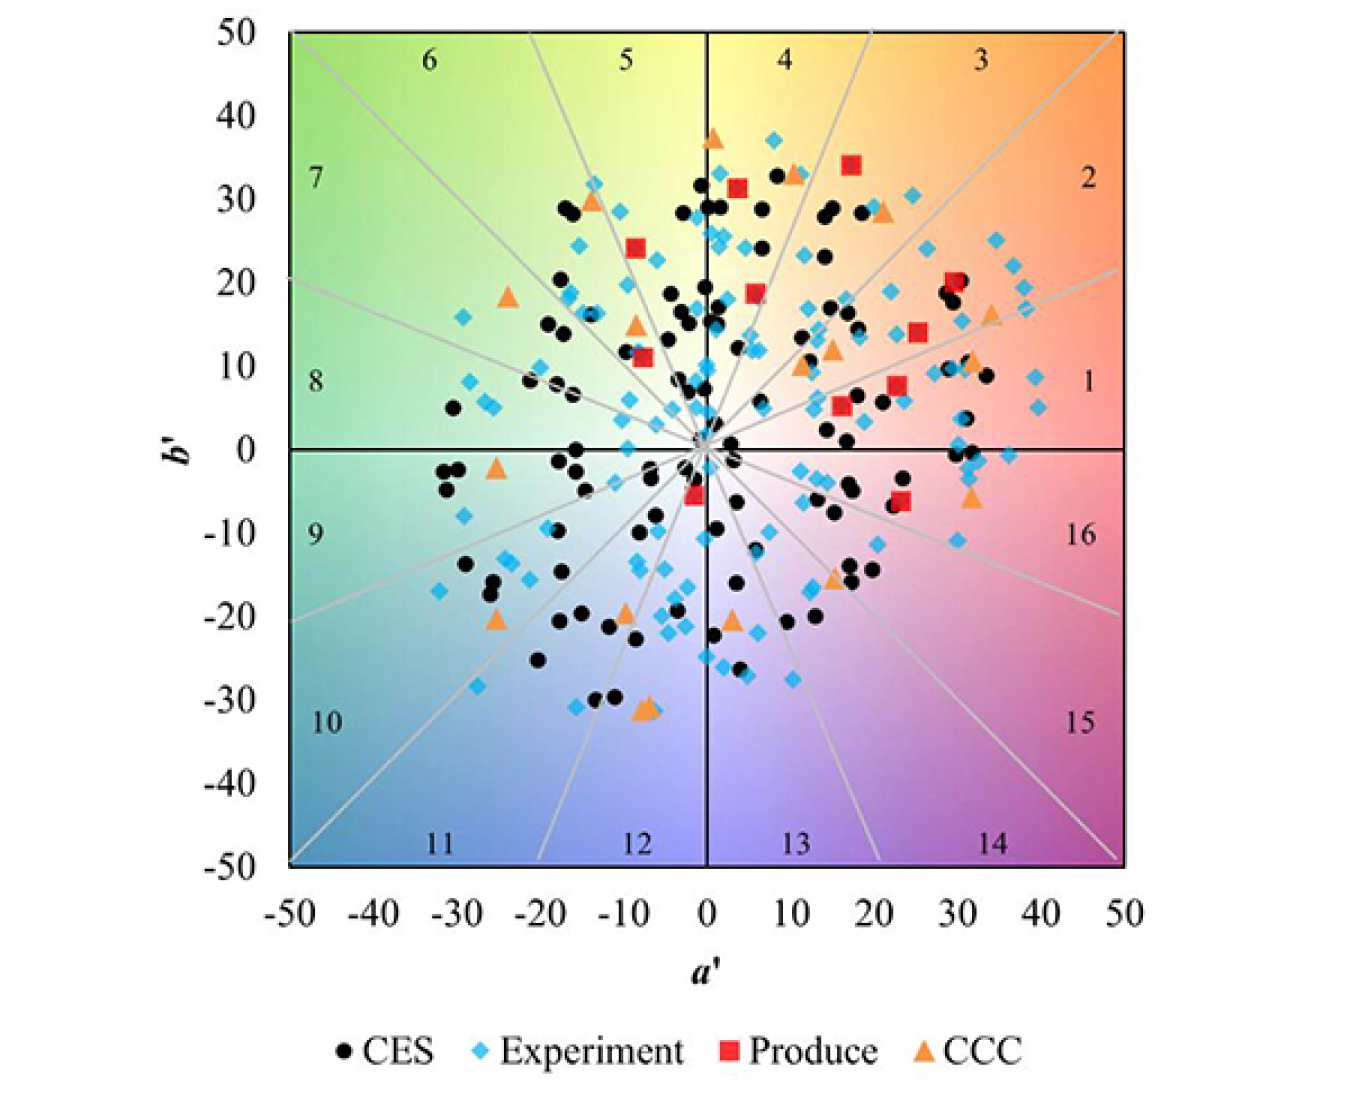
Color coordinates for the four object sets evaluated.
This paper documents the role of the reference illuminant in the IES TM-30-15 method for evaluating color rendition. TM-30-15 relies on a relative reference scheme; that is, the reference illuminant and test source always have the same correlated color temperature (CCT). The reference illuminant is a Planckian radiator, model of daylight, or combination of those two, depending on the exact CCT of the test source. Three alternative reference schemes were considered: 1) either using all Planckian radiators or all daylight models, while maintaining the CCT match of the test and reference; 2) using only one of ten possible illuminants (Planckian, daylight, or equal energy), regardless of the CCT of the test source; 3) using an off-Planckian reference illuminant (i.e., a source with a negative Duv).
No reference scheme is inherently superior to another, with differences in metric values largely a result of small differences in gamut shape of the reference alternatives. While using any of the alternative schemes is more reasonable in the TM-30-15 evaluation framework than it was with the CIE Test Color Method, the differences still ultimately manifest only as changes in interpretation of the results. Reference illuminants are employed in TM-30 to provide a familiar point of comparison, not to establish an ideal source.
Comparison of CIE D Series Illuminants and Planckian radiation at the same CCTs.
(August 2016, Lighting Research & Technology)
An experiment was conducted to evaluate how subjective impressions of a light source’s color quality depend upon the details of the shifts it causes in the color appearance of illuminated objects. Twenty-eight participants each evaluated 26 lighting conditions in a 3.1 m by 3.7 m room filled with objects selected to cover a range of hue, saturation, and lightness. TM-30 Fidelity Index (Rf) values ranged from 64 to 93, Gamut Index (Rg) values from 79 to 117, and Hue Angle Bin 1 Chroma Shift (Rcs,h1) values from -19% to 26%. All lighting conditions had the same nominal illuminance and chromaticity.
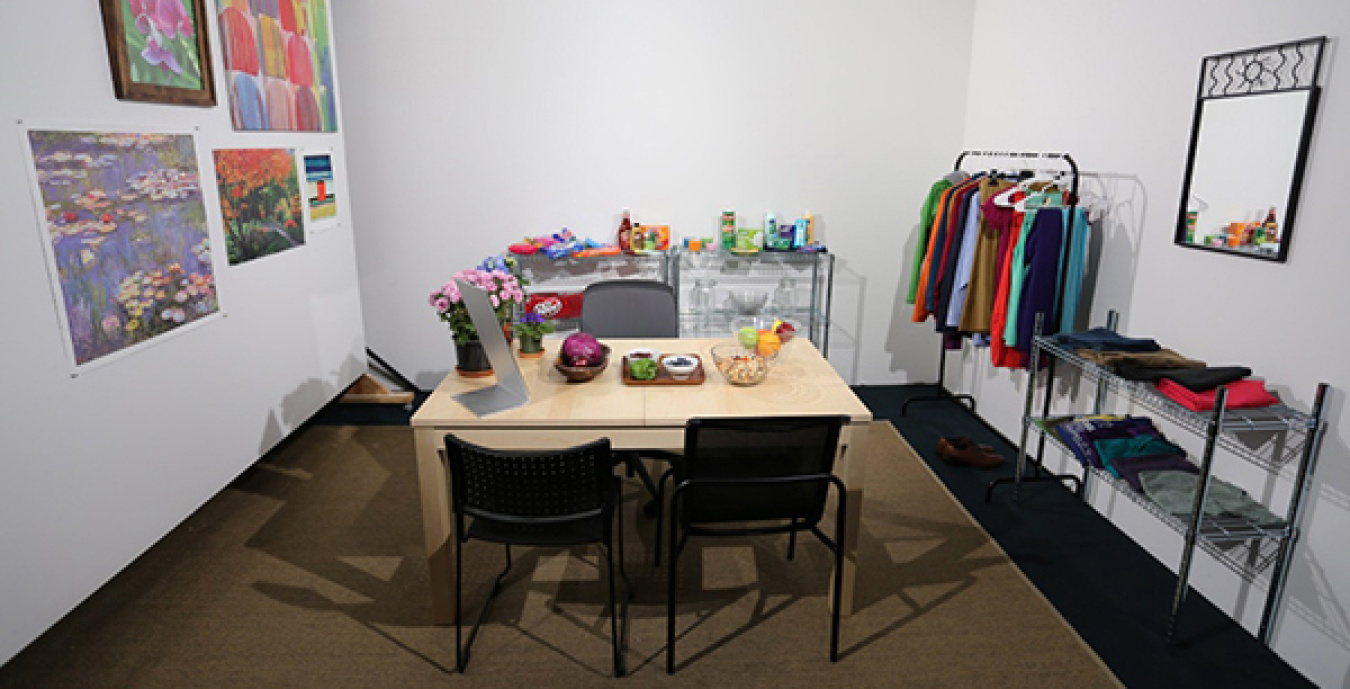
Color rendition testing room.
Participants were asked to rate each condition on eight-point scales for saturated-dull, normal-shifted, and like-dislike, as well as classifying the condition as one of saturated, dull, normal, or shifted. The findings suggest that gamut shape is more important than average gamut area for modeling human preference, with red playing a more important role than other hues. Average fidelity alone is a weak predictor of human perception, especially CIE Ra (i.e., CRI). Nine of the top 12 rated products had a CIE Ra value of 73 or less, which indicates that the criteria of CIE Ra ≥ 80 may be excluding many preferred light sources.
A two-measure system for evaluating light sources’ color rendition has been developed that builds upon conceptual progress of numerous researchers over the last two decades. The system quantifies the color fidelity and color gamut (change in object chroma) of a light source in comparison to a reference illuminant. The calculations are based on a newly developed set of reflectance data from real samples uniformly distributed in color space (thereby fairly representing all colors) and in wavelength space (thereby precluding artificial optimization of the color rendition scores by spectral engineering). The color fidelity score Rf is an improved version of the CIE color rendering index. The color gamut score Rg is an improved version of the Gamut Area Index. In combination, they provide two complementary assessments to guide the optimization of future light sources. This method summarizes the findings of the Color Metric Task Group of the Illuminating Engineering Society of North America (IES). It is adopted in the upcoming IES TM-30-2015, and is proposed for consideration with CIE.
RESOURCES
TM-30 Frequently Asked Questions
IES Webinar: TM-30, In 2018 and Beyond: Guidance for Improving Color Quality
IES Webinar: Metrics in Motion: Color Metrics
Webinar: What Have We Learned About TM-30 in the Past Two Years?
Video: TM-30 Basics
Application webinar: Understanding and Applying TM-30-15: IES Method for Evaluating Light Source Color Rendition
Technical webinar: A Technical Discussion of TM-30-15: Why and How it Advances Color Rendition Metric
Related Presentations
In Support of the IES Method of Evaluating Light Source Colour Rendition (November 2015, Lighting Research & Technology)
IES TM-30-15 Is Approved—Now What? Moving Forward with New Color Rendition Measures (October 2015, Leukos)