2018 EIA MECS data footprints now available.
Note: This page was updated in September 2018 with the most recent manufacturing energy and carbon footprints (using the latest U.S. Energy Information Administration (EIA) Manufacturing Energy Consumption Survey (MECS) data for 2014 and updated assumptions). Earlier versions of the footprints are still available: 2010 EIA MECS data footprints and 2006 EIA MECS data footprints. Detailed analysis of the footprints and sector rankings, utilizing 2006 data, is available in the U.S. Manufacturing Energy Use and Greenhouse Gas Emissions Analysis report. For more information, email the webmaster.
Manufacturing Energy and Carbon Footprints map the flow of energy supply, demand, and losses as well as greenhouse gas combustion emissions in diverse U.S. manufacturing industries, based on EIA MECS data for 2014.
Energy and carbon footprints map energy use and carbon emissions in manufacturing from energy supply to end use. The footprints show where energy is used and lost—and the associated greenhouse gases (GHGs) emitted through combustion. Each footprint visualizes the flow of energy (in the form of fuel, electricity, or steam) to major end uses in manufacturing, including boilers, combined heat and power generation, process heaters, process coolers, machine-driven equipment, facility HVAC, and lighting.
AVAILABLE 2014 DATA FOOTPRINTS
Footprints are available for 15 manufacturing sectors that collectively represent 94% of all manufacturing primary energy use, as well as for U.S. manufacturing as a whole in 2014. The 16 footprints are accessible through the links below.
- All Manufacturing
- Alumina and Aluminum
- Cement
- Chemicals
- Computers, Electronics and Electrical Equipment
- Fabricated Metals
- Food and Beverage
- Forest Products
- Foundries
- Glass
- Iron and Steel
- Machinery
- Petroleum Refining
- Plastics
- Textiles
- Transportation Equipment
FOOTPRINT CONTENT
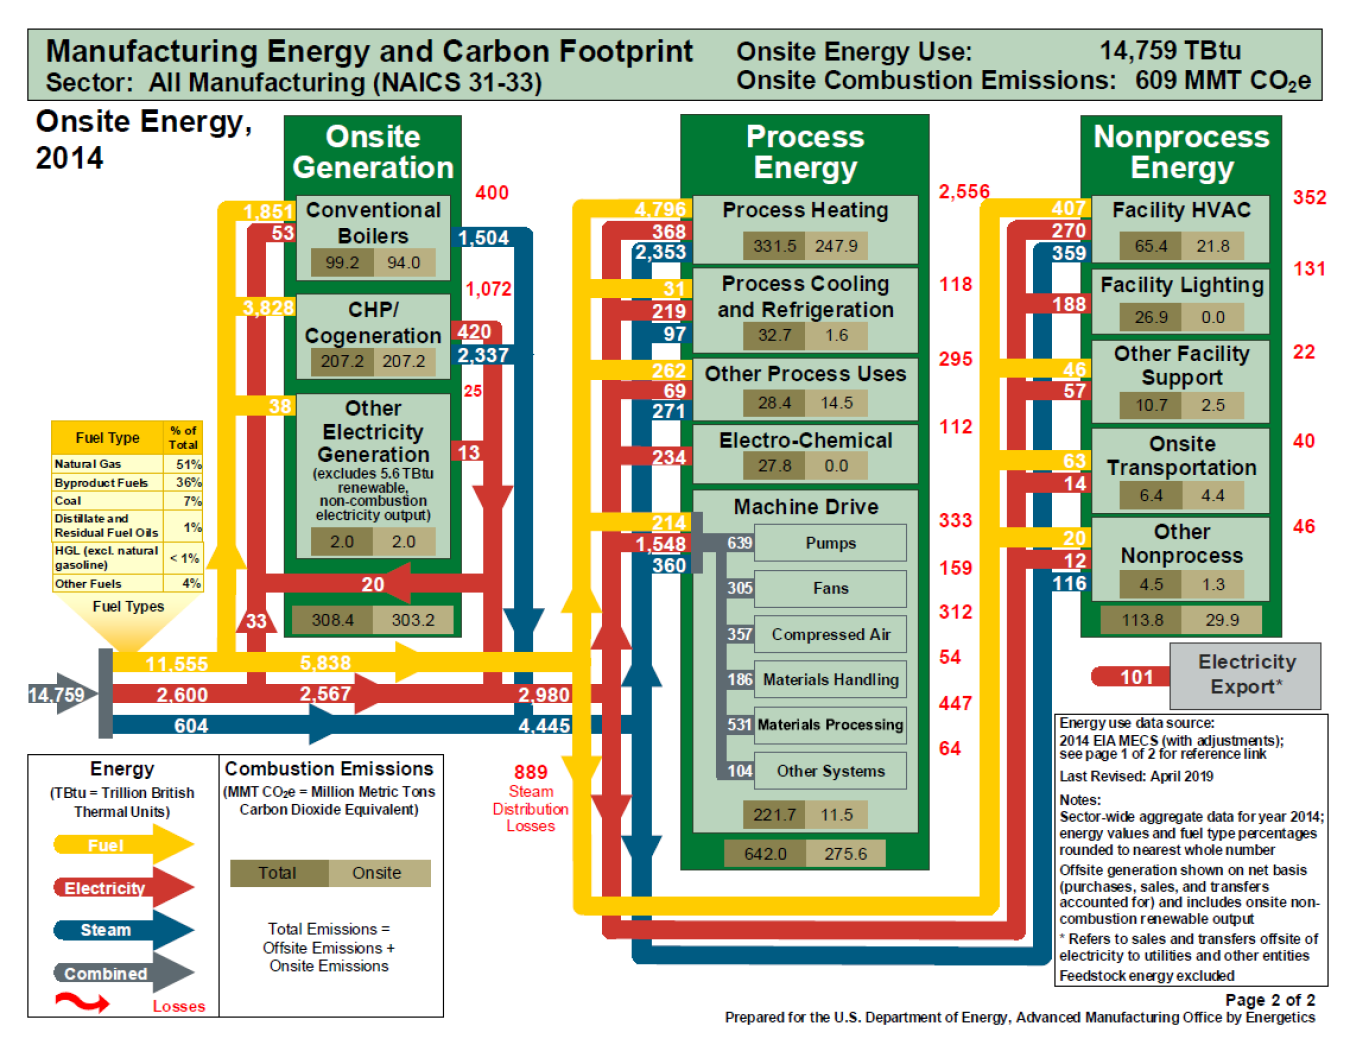
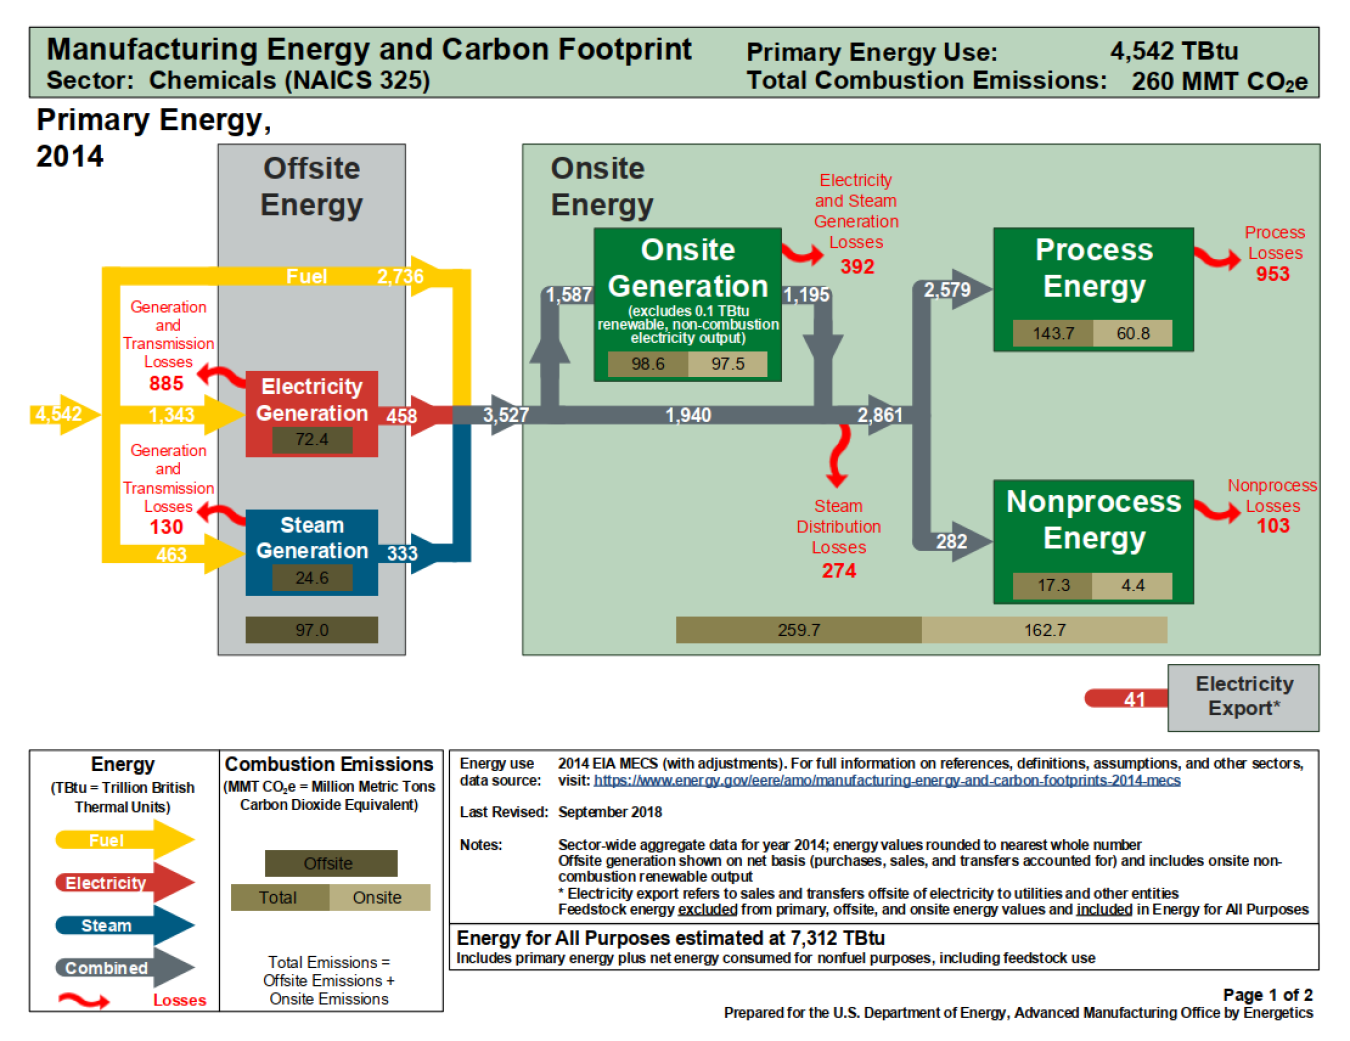
Each footprint presents data at two levels of detail. The first page provides a high-level view of supply and end use (primary energy use), while the second page shows details of how energy is distributed to onsite end uses. The analyses are based on manufacturing energy consumption data from EIA’s Manufacturing Energy Consumption Survey (MECS) data for 2014, along with referenced energy loss and emission factors, and input from industry and subject matter experts.
Footprints show aggregate data for each sector, including:
- Electricity and steam generated offsite and transferred to the facility, as well as electricity and steam generated onsite
- Fuel, electricity, and steam consumed by major end uses in a manufacturing facility
- Offsite and onsite energy losses due to the generation, transmission, and distribution, and end use consumption of energy (some losses are unrecoverable)
- GHG emissions released during the combustion of fuel
FOOTPRINT PURPOSE
Footprints can help users better understand the distribution of energy use and compare use, loss, and GHG combustion emissions within and across manufacturing sectors. Areas of high energy consumption or significant energy losses indicate possible opportunities to improve efficiency by implementing energy management best practices, upgrading energy systems, or developing new technologies. The footprints provide a macro-scale benchmark for evaluating the benefits of improving energy efficiency and for prioritizing opportunity analysis.
ADDITIONAL ANALYSIS
The U.S. Manufacturing Energy Use and Greenhouse Gas Emissions Analysis report expands on the Energy and Carbon Footprints based on 2006 EIA MECS data to trace energy from supply (fuel, electricity, and steam) to major end-use applications in U.S. manufacturing. The report ranks the energy use, energy losses, and greenhouse gas (GHG) combustion emissions of 15 sectors.
LEARN MORE ABOUT ENERGY AND CARBON FOOTPRINTS
Understanding Energy and Carbon Footprints
Information to help understand the footprints
Scope of Footprints
Descriptions of manufacturing sectors by North American Industry Classification System (NAICS) code
Definitions and Assumptions
A glossary of footprint terms and a listing of footprint assumptions, including generation and end use equipment efficiencies, cogeneration efficiencies, process heating losses, steam distribution to end uses, and fuel combustion emission factors
References
Footprint analysis data sources
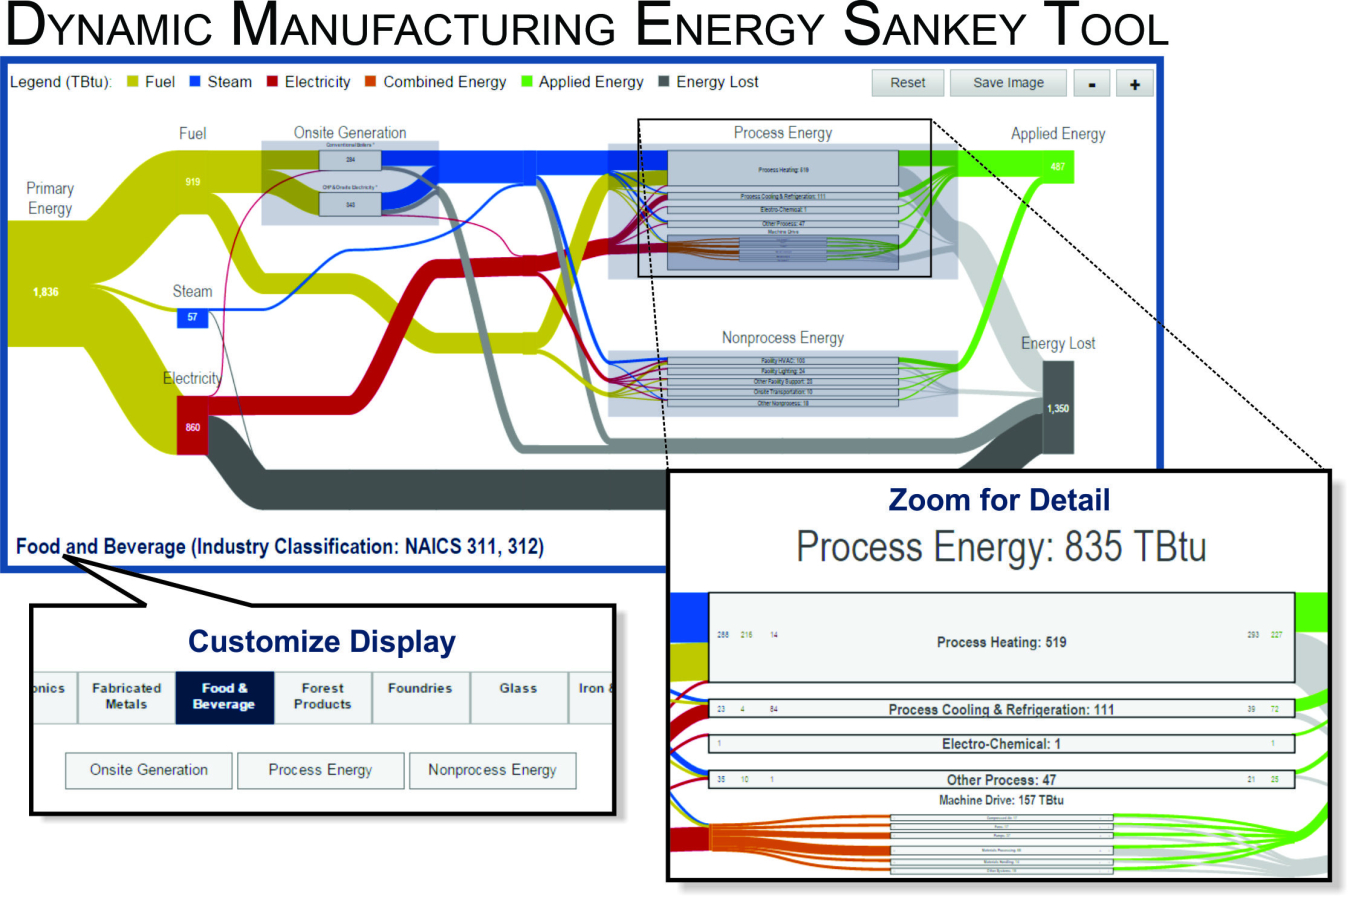
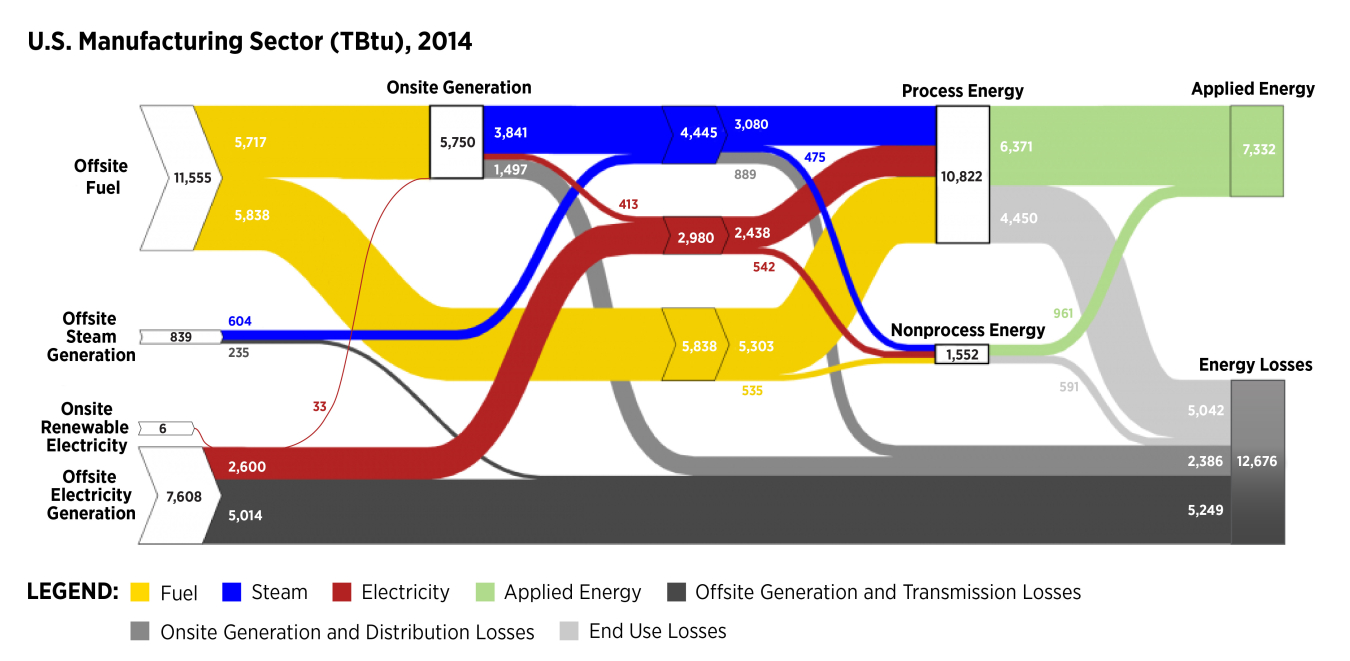
MANUFACTURING ENERGY SANKEY DIAGRAMS
Manufacturing energy Sankey diagrams map the flow of energy supply, demand, and losses in the U.S. manufacturing sector using data from the AMO Manufacturing Energy and Carbon Footprints for 2010 and 2014. The Sankey diagrams complement the Footprints by graphically presenting weighted energy flow lines. The energy pathway—from primary sources (fuel, steam, and electricity) to facility end use—is shown in a single image, including the energy that is applied to produce products and the combined energy losses. The Sankey diagrams rely on energy data from the EIA Manufacturing Energy Consumption Survey data for 2010 and 2014.
Dynamic Manufacturing Energy Sankey Tool
Users can pan, zoom, and customize the display to explore the flow of energy use or compare energy consumption across manufacturing subsectors. Selected images can be saved for export.