
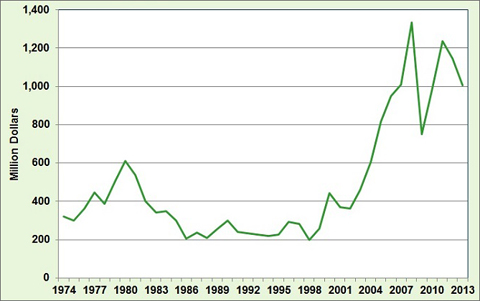
Over the last three decades, the amount of money the U.S. spent on imported petroleum varied widely. In 1988 and 1998, about $200 million per day was spent on imported petroleum, but in 2008 it was more than $1,300 million per day. In 2009 lower demand and a collapse in oil prices caused the expenditures to fall to about $750 million per day. Since that time the spending has been closer to $1,000 million per day or more.
Dollars per Day Spent on U.S. Petroleum Imports
Image
Supporting Information
| Year | 2013 Constant Dollars (Millions) |
|---|---|
| 1980 | 609 |
| 1981 | 538 |
| 1982 | 400 |
| 1983 | 341 |
| 1984 | 350 |
| 1985 | 299 |
| 1986 | 205 |
| 1987 | 238 |
| 1988 | 209 |
| 1989 | 256 |
| 1990 | 301 |
| 1991 | 241 |
| 1992 | 233 |
| 1993 | 225 |
| 1994 | 219 |
| 1995 | 228 |
| 1996 | 293 |
| 1997 | 283 |
| 1998 | 197 |
| 1999 | 257 |
| 2000 | 442 |
| 2001 | 370 |
| 2002 | 364 |
| 2003 | 459 |
| 2004 | 606 |
| 2005 | 817 |
| 2006 | 949 |
| 2007 | 1,008 |
| 2008 | 1,334 |
| 2009 | 749 |
| 2010 | 976 |
| 2011 | 1,238 |
| 2012 | 1,144 |
| 2013 | 1,005 |
| Note: Expenditures were adjusted to 2013 constant dollars using the Consumer Price Index. Source: U.S. Energy Information Administration, Monthly Energy Review, January 2014, Table 1.5. | |