
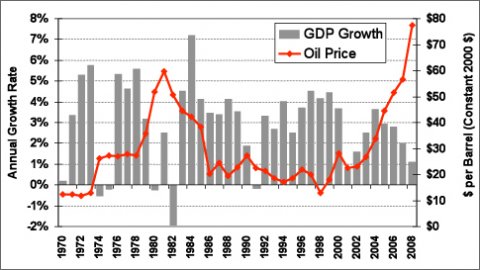
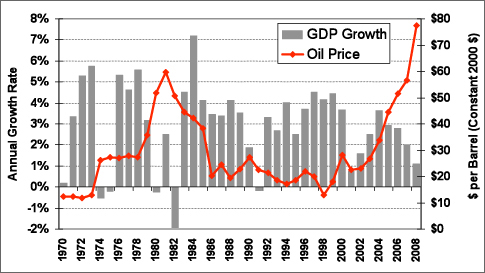
Major oil price shocks have disrupted world energy markets five times in the past 30 years – 1973-74, 1979-80, 1990-1991, 1999-2000 and again in 2008. Most of the oil price shocks were followed by an economic recession in the U.S.
Oil Price and Economic Growth, 1970-2008
Image
Image
Supporting Information
| Year | Gross Domestic Product Growth Rate | Oil Price 2008 constant dollars per barrel |
|---|---|---|
| 1970 | 0.17% | $12.35 |
| 1971 | 3.36% | $12.45 |
| 1972 | 5.29% | $11.87 |
| 1973 | 5.76% | $13.03 |
| 1974 | -0.50% | $26.12 |
| 1975 | -0.19% | $27.31 |
| 1976 | 5.33% | $27.09 |
| 1977 | 4.62% | $27.98 |
| 1978 | 5.57% | $27.23 |
| 1979 | 3.16% | $35.76 |
| 1980 | -0.23% | $51.94 |
| 1981 | 2.52% | $59.61 |
| 1982 | -1.94% | $50.81 |
| 1983 | 4.52% | $44.46 |
| 1984 | 7.19% | $42.32 |
| 1985 | 4.13% | $38.37 |
| 1986 | 3.47% | $20.42 |
| 1987 | 3.38% | $24.45 |
| 1988 | 4.13% | $19.38 |
| 1989 | 3.54% | $22.88 |
| 1990 | 1.88% | $27.23 |
| 1991 | -0.17% | $22.57 |
| 1992 | 3.33% | $21.33 |
| 1993 | 2.67% | $18.57 |
| 1994 | 4.02% | $17.27 |
| 1995 | 2.50% | $18.71 |
| 1996 | 3.70% | $22.07 |
| 1997 | 4.50% | $19.96 |
| 1998 | 4.18% | $12.98 |
| 1999 | 4.45% | $17.89 |
| 2000 | 3.66% | $28.26 |
| 2001 | 0.75% | $22.41 |
| 2002 | 1.60% | $23.13 |
| 2003 | 2.51% | $26.81 |
| 2004 | 3.64% | $33.78 |
| 2005 | 2.94% | $44.45 |
| 2006 | 2.78% | $51.63 |
| 2007 | 2.03% | $56.70 |
| 2008 | 1.11% | $77.38 |
Source: Oak Ridge National Laboratory, Transportation Energy Data Book: Edition 28, Figure 3.1, June 2009. | ||