
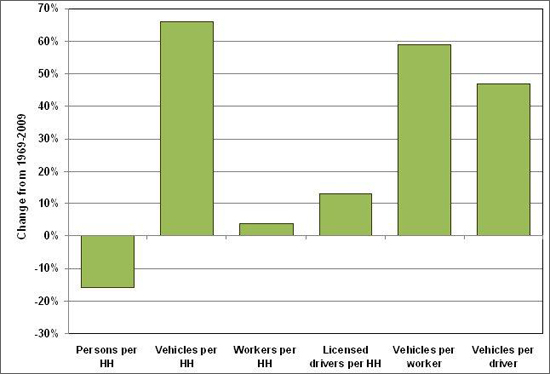
Since 1969, the number of vehicles per household has increased by 66% and the number of vehicles per licensed driver has increased by 47%. The number of workers per household has changed the least of the statistics shown here. There has been a decline in the number of persons per household from 1969 to 2009.
Demographic Statistics from the Nationwide Household Travel Surveys
Image

Supporting Information
| 1969 | 1977 | 1983 | 1990 | 1995 | 2001 | 2009 | Percent change 1969–2009 | |
|---|---|---|---|---|---|---|---|---|
| Persons per household | 3.16 | 2.83 | 2.69 | 2.56 | 2.63 | 2.58 | 2.66 | -16% |
| Vehicles per household | 1.16 | 1.59 | 1.68 | 1.77 | 1.78 | 1.89 | 1.92 | 66% |
| Workers per household | 1.21 | 1.23 | 1.21 | 1.27 | 1.33 | 1.35 | 1.26 | 4% |
| Licensed drivers per household | 1.65 | 1.69 | 1.72 | 1.75 | 1.78 | 1.77 | 1.87 | 13% |
| Vehicles per worker | 0.96 | 1.29 | 1.39 | 1.40 | 1.34 | 1.39 | 1.52 | 59% |
| Vehicles per licensed driver | 0.70 | 0.94 | 0.98 | 1.01 | 1.00 | 1.06 | 1.03 | 47% |
Sources: | ||||||||