
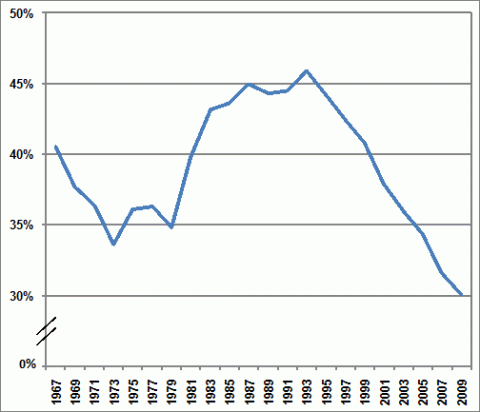
Although the average expenditure for a new car has increased from 1967 to 2009, family earnings have also been on the rise. For this period, new car expenditures went from $3,216 to $23,186, while median family earnings went from $7,933 to $77,149. The expenditure for a new car as a percentage of annual median family earnings reached its peak in 1993 at more than 45%; in 2009 it declined to its lowest point at just 30%.
Average Vehicle Expenditure as a Percentage of Annual Median Family Earnings, 1967-2009
Image
Image
Supporting Information
| Year | Average Expenditure for a New Car | Annual Median Family Earnings | New Car Expenditure Share of Annual Median Family Earnings |
|---|---|---|---|
| 1967 | $3,216 | $7,933 | 40.5% |
| 1969 | $3,557 | $9,433 | 37.7% |
| 1971 | $3,742 | $10,285 | 36.4% |
| 1973 | $4,052 | $12,051 | 33.6% |
| 1975 | $4,950 | $13,719 | 36.1% |
| 1977 | $5,814 | $16,009 | 36.3% |
| 1979 | $6,847 | $19,661 | 34.8% |
| 1981 | $8,910 | $22,388 | 39.8% |
| 1983 | $10,606 | $24,580 | 43.1% |
| 1985 | $11,838 | $27,144 | 43.6% |
| 1987 | $13,386 | $29,744 | 45.0% |
| 1989 | $14,371 | $32,448 | 44.3% |
| 1991 | $15,475 | $34,775 | 44.5% |
| 1993 | $16,871 | $36,764 | 45.9% |
| 1995 | $17,959 | $40,572 | 44.3% |
| 1997 | $19,236 | $45,326 | 42.4% |
| 1999 | $20,710 | $50,784 | 40.8% |
| 2001 | $21,474 | $56,628 | 37.9% |
| 2003 | $21,646 | $60,135 | 36.0% |
| 2005 | $23,017 | $66,977 | 34.4% |
| 2007 | $23,892 | $75,610 | 31.6% |
| 2009 | $23,186 | $77,149 | 30.1% |
* Even years not included. | |||