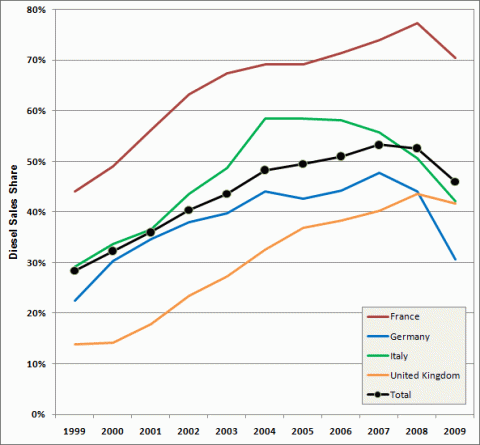
The share of new diesel vehicles sold in Western Europe rose steadily from 1999 to 2007. However, from 2007 to 2009, the share of diesel vehicle sales has begun to decline. Germany and Italy have experienced the greatest declines in diesel vehicle sales, though other countries in Western Europe have shown a similar trend.
Share of Diesel Vehicle Sales in Western Europe, 1999-2009
Supporting Information
| 1999 | 2000 | 2001 | 2002 | 2003 | 2004 | 2005 | 2006 | 2007 | 2008 | 2009 | |
|---|---|---|---|---|---|---|---|---|---|---|---|
| Belgium* | 54.3% | 56.7% | 62.6% | 64.2% | 68.3% | 69.9% | 72.9% | 74.7% | 76.9% | 78.7% | 75.1% |
| France | 44.1% | 49.0% | 56.2% | 63.2% | 67.4% | 69.2% | 69.1% | 71.4% | 73.9% | 77.3% | 70.4% |
| Germany | 22.4% | 30.4% | 34.6% | 38.0% | 39.8% | 44.0% | 42.7% | 44.3% | 47.7% | 44.1% | 30.7% |
| Italy | 29.1% | 33.7% | 36.6% | 43.6% | 48.7% | 58.4% | 58.5% | 58.2% | 55.7% | 50.6% | 42.2% |
| Norway | 8.2% | 9.0% | 13.3% | 17.5% | 23.2% | 27.0% | 39.2% | 48.4% | 74.4% | 72.4% | 72.7% |
| Spain | 51.7% | 53.1% | 52.5% | 57.3% | 60.4% | 65.1% | 67.8% | 70.0% | 70.8% | 69.3% | 70.1% |
| Switzerland | 6.6% | 9.2% | 13.3% | 17.8% | 21.5% | 25.9% | 28.1% | 30.0% | 32.5% | 32.4% | 29.6% |
| United Kingdom | 13.8% | 14.1% | 17.8% | 23.5% | 27.3% | 32.5% | 36.8% | 38.3% | 40.2% | 43.6% | 41.7% |
| Total | 28.4% | 32.3% | 36.0% | 40.4% | 43.6% | 48.3% | 49.5% | 51.0% | 53.3% | 52.6% | 46.0% |
* Beginning in 2005, Belgium data also include Luxembourg. | |||||||||||


