
Photo
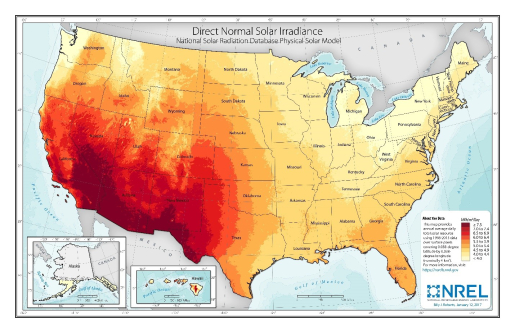
Photo Title
Direct Normal Solar Irradiance
Caption
This map provides annual average daily total solar resource using 1998-2015 data over surface pixels covering 0.038 degree latitude by 0.038 degree longitude.
Credit
NREL
Photo
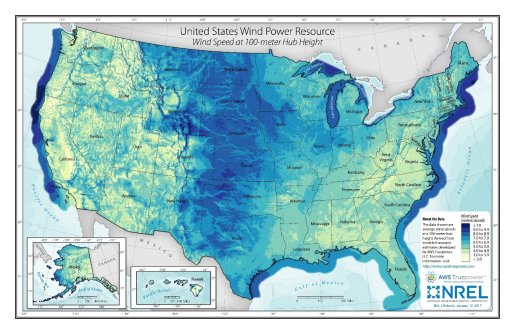
Photo Title
United States Wind Power Resource
Caption
This data shows the average wind speeds at a 100-meter hub height derived from modeled resource estimates developed by AWS Truepower, LLC.
Credit
NREL
Photo
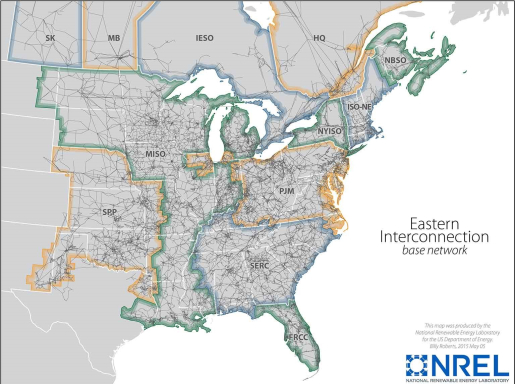
Photo Title
Eastern Interconnection
Caption
The Eastern Interconnection base network.
Credit
NREL
Photo
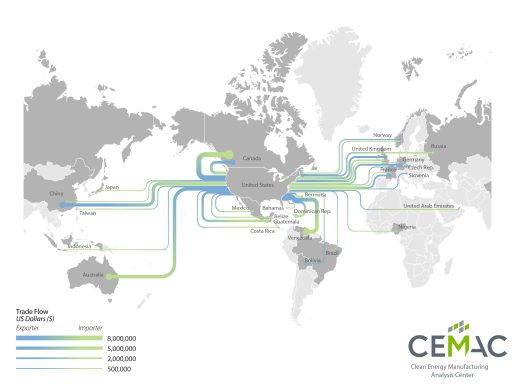
Photo Title
Trade Flow
Caption
This map shows the international trade flow in U.S. dollars for exporting and importing clean energy technology products.
Credit
NREL
Photo
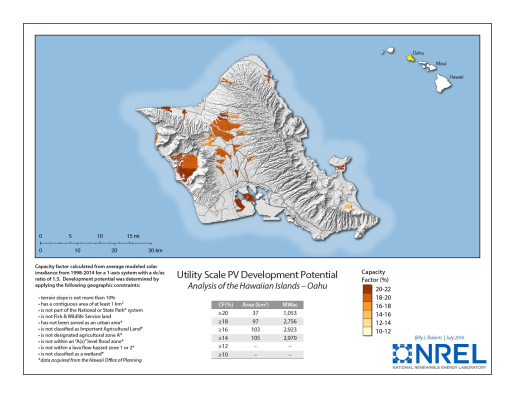
Photo Title
Utility Scale PV Development Potential
Caption
This map is an analysis of the Hawaiian Islands-Oahu. Capacity factor is calculated from average modeled solar irradiance from 1998-2014 for a 1-axis system with a dc/ac ratio of 1.5.
Credit
NREL
Photo
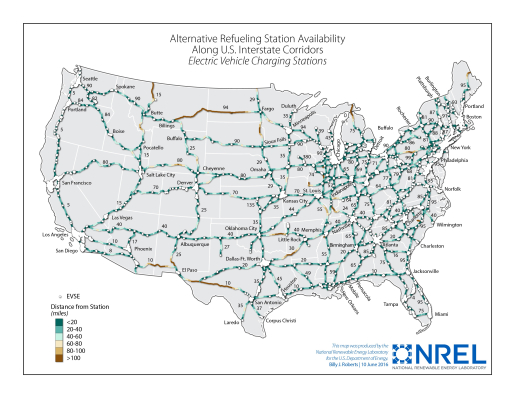
Photo Title
Alternative Refueling Station Availability
Caption
This map shows the alternative refueling station availability along U.S. Interstate corridors for electric vehicle charging stations.
Credit
NREL
Photo
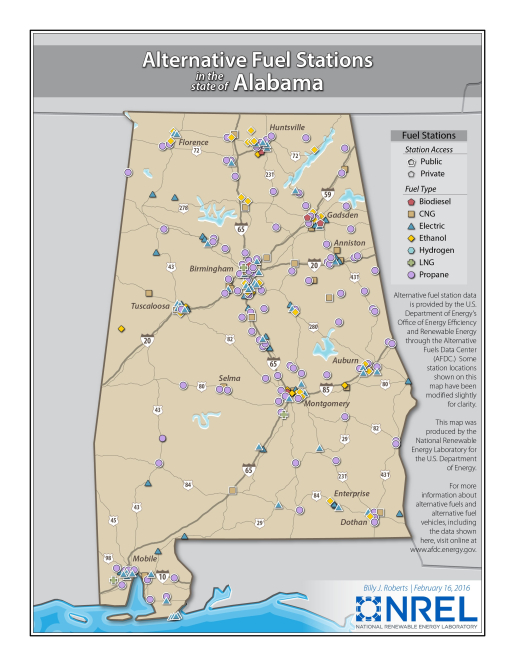
Photo Title
Alternative Fuel Stations in Alabama
Caption
The alternative fuel station data is provided by the Office of Energy Efficiency and Renewable Energy through the Alternative Fuels Data Center.
Credit
NREL
Photo
Photo Title
Direct Normal Solar Irradiance
Caption
This map provides annual average daily total solar resource using 1998-2015 data over surface pixels covering 0.038 degree latitude by 0.038 degree longitude.
Credit
NREL
Direct Normal Solar Irradiance
This map provides annual average daily total solar resource using 1998-2015 data over surface pixels covering 0.038 degree latitude by 0.038 degree longitude.
NREL
May 16, 2026