The Federal Energy Management Program (FEMP) provides the following information as an overview of current federal agency use of renewable electric energy. Based on the federal purchase requirement in 42 U.S.C. § 15852, the Federal Government must consume at least 7.5% of its total electricity from renewable sources each fiscal year, to the extent economically feasible and technically practicable. As defined by 42 U.S.C. § 15852(b)(2), “the term ‘renewable energy’ means marine energy (as defined in section 17211 of this title), or electric energy produced from solar, wind, biomass, landfill gas, geothermal, municipal solid waste, or new hydroelectric generation capacity achieved from increased efficiency or additions of new capacity at an existing hydroelectric project.”
Refer to the Federal Renewable Energy Use Statutory Requirement for additional information.
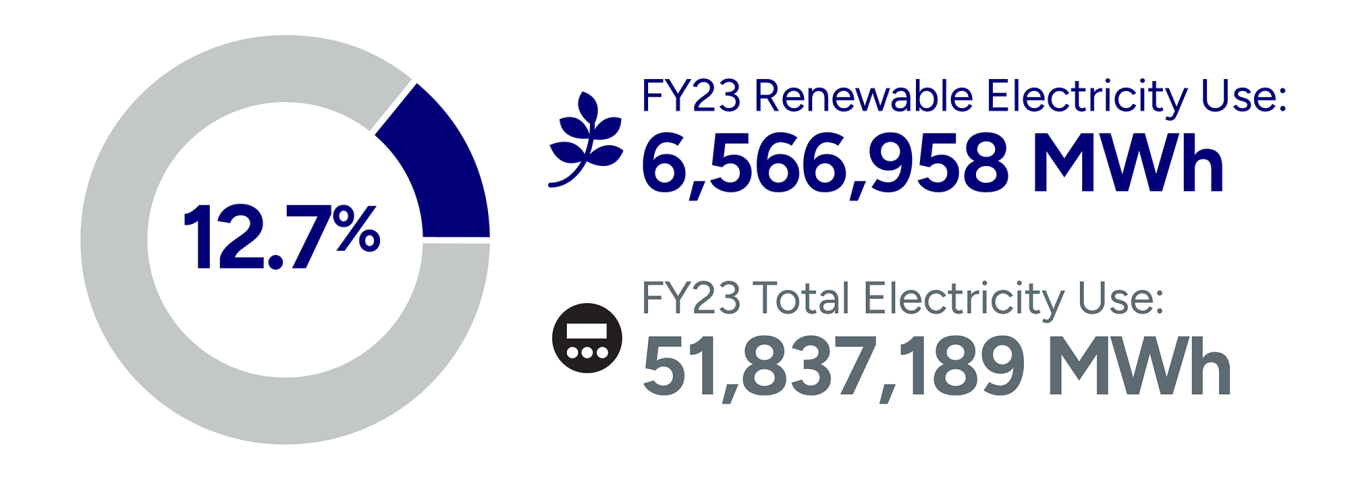
In Fiscal Year (FY) 2023, federal agencies used more than 6.5 million megawatt-hours (MWh) of renewable electric energy out of 51.8 million MWh total electricity use. FEMP helps agencies meet statutory renewable electricity requirements and accomplish their missions through investment in resilient and reliable energy-generation projects and purchases. For further information about agency on-site renewable installations, including cost-saving project demonstrations, visit the FEMP Case Studies Map under “Distributed Energy.”
Total FY 2023 Renewable Electricity Use
Federal agencies used 12.7% renewable electricity in FY 2023.
Federal energy performance data is from FEMP's Comprehensive Annual Energy Data and Sustainability Performance website.
Read more about the federal government's progress toward efficiency requirements.
Ready to Plan a Project?
FEMP’s distributed energy project implementation process guides the way from start to finish.
FY 2023 Renewable Electricity Technologies
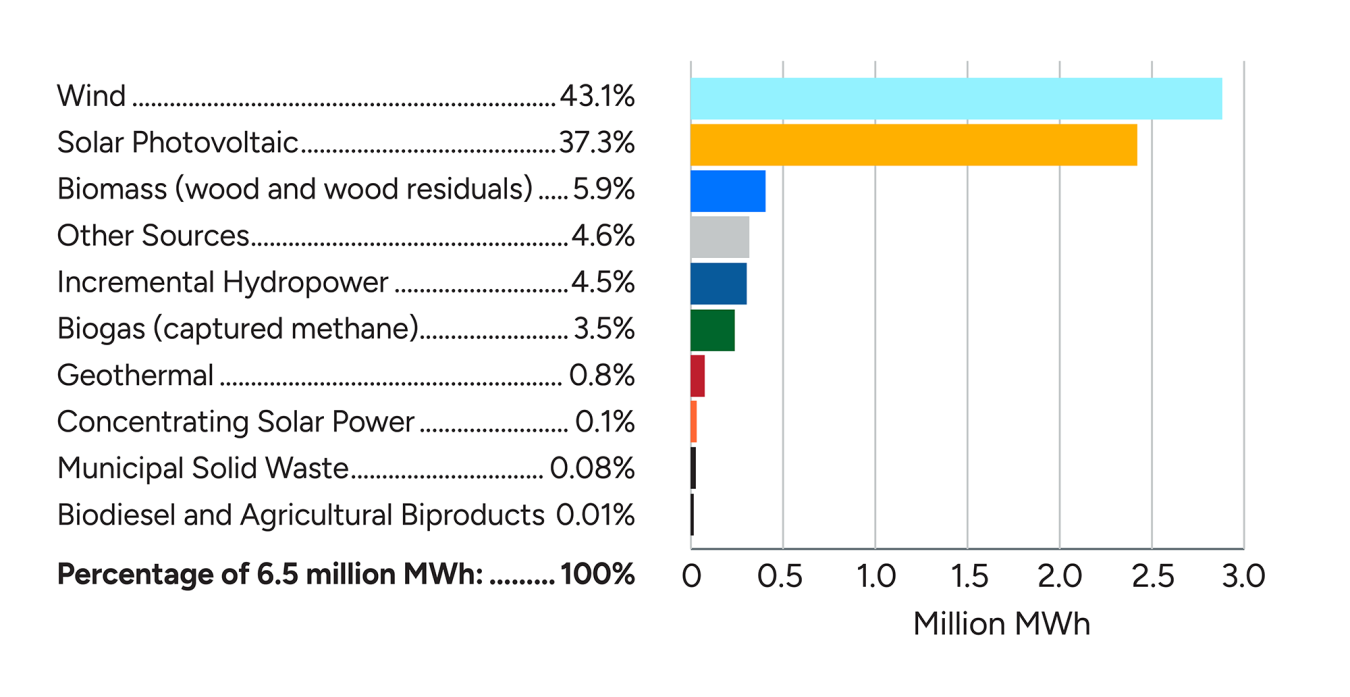
Federal agencies used 6.5 million MWh of renewable electricity generated by the following technologies.
Renewable Energy Technology MWh Percentage of 6.5 million MWh* Wind 2,829,774 43.1% Solar Photovoltaic 2,447,051 37.3% Biomass (wood and wood residuals) 388,657 5.9% Other Sources 304,752 4.6% Incremental Hydropower 295,014 4.5% Biogas (captured methane) 231,758 3.5% Geothermal 55,400 0.8% Concentrating Solar Power 8,349 0.1% Municipal Solid Waste 5,513 0.08% Biodiesel and Agricultural Biproducts 691 0.01% Total: 6,566,958 100% * Numbers presented are rounded.
FY 2023 Renewable Electricity Use by Agency
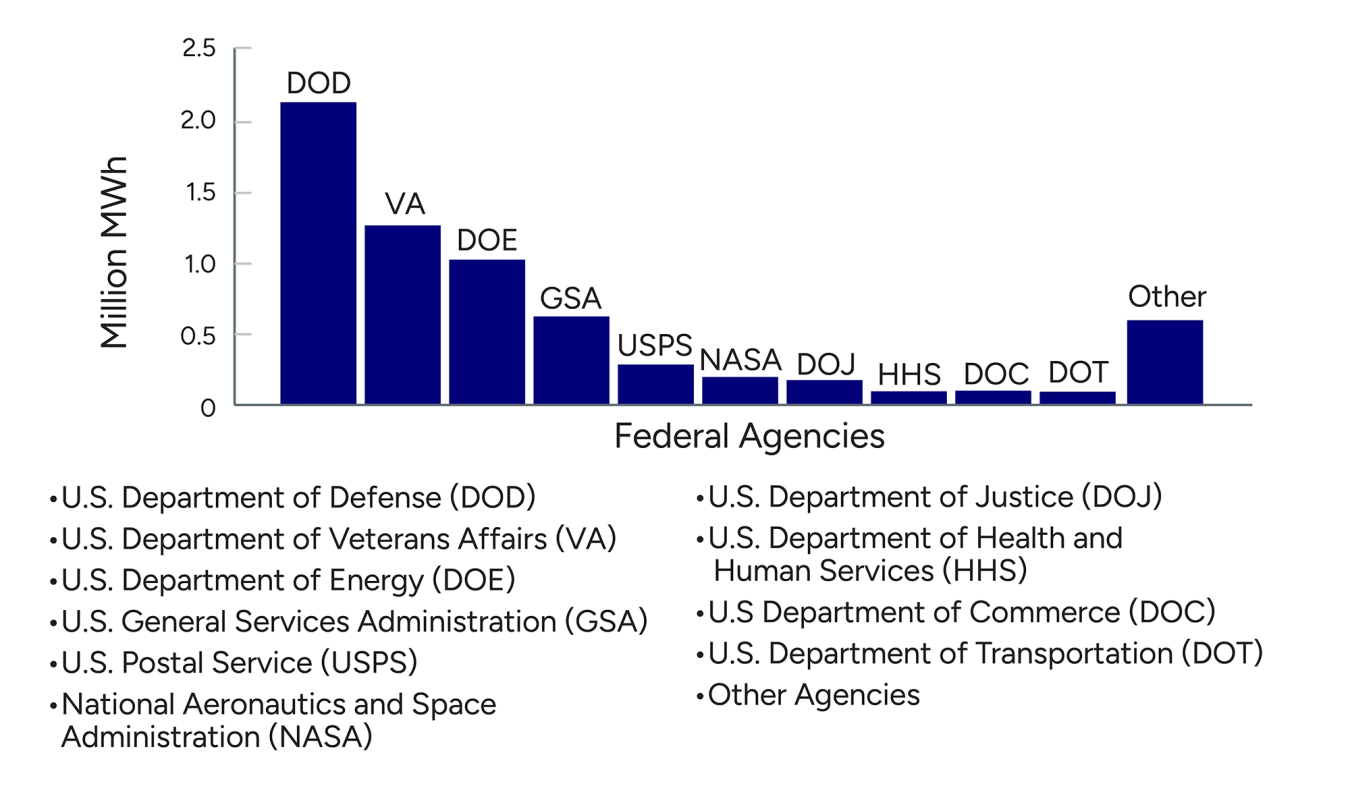
The following federal agencies were the top users of renewable electricity in FY 2023.
Agency Abbreviation Renewable Electric Energy Used (MWh) U.S. Department of Defense DOD 2,175,802 U.S. Department of Veterans Affairs VA 1,263,395 U.S. Department of Energy DOE 1,015,115 U.S. General Services Administration GSA 612,582 U.S. Postal Service USPS 280,738 National Aeronautics and Space Administration NASA 193,271 U.S. Department of Justice DOJ 167,396 U.S. Department of Health and Human Services HHS 94,875 U.S Department of Commerce DOC 90,748 U.S. Department of Transportation DOT 85,161 Other Agencies Other 587,875 Total: 6,566,958
FY 2023 Renewable Electricity Procurement Methods
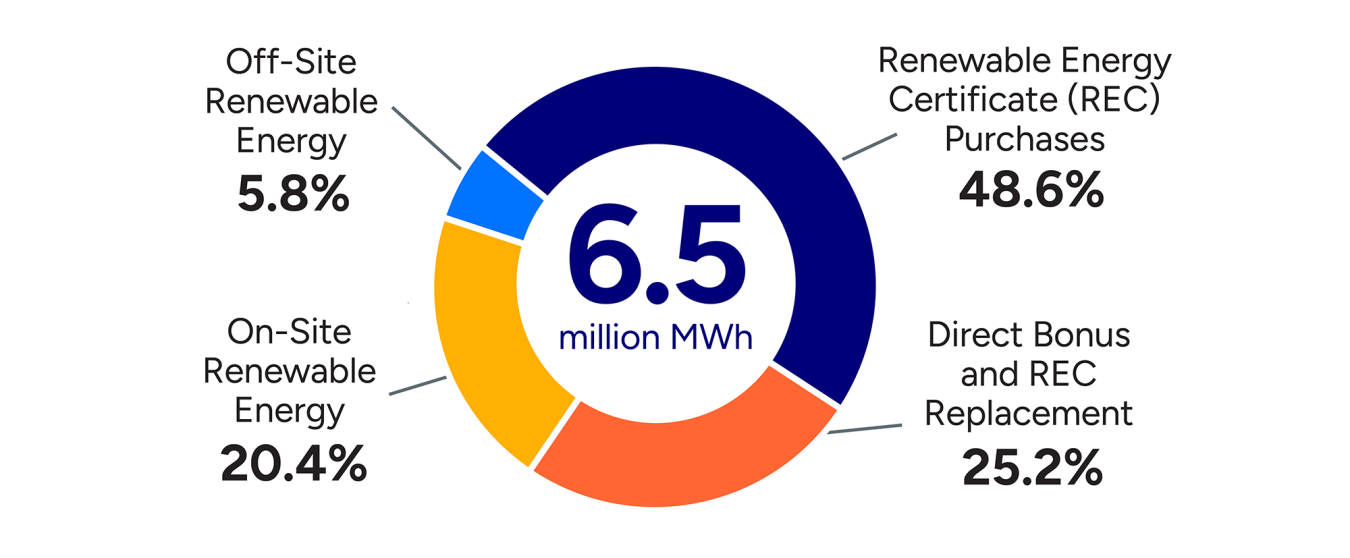
Federal agencies procured 6.5 million MWh of renewable electricity using the following methods.
Review on-site distributed energy procurement options for federal agencies.
Learn how to purchase off-site clean energy.
Procurement Method MWh Percentage of 6.5 million MWh On-site renewable energy 1,340,560 20.4% Off-site renewable energy 380,592 5.8% Renewable energy certificate (REC) purchases 3,192,573 48.6% Direct bonus and REC replacement 1,653,233 25.2%
On-site renewable energy: Produced from projects on federal or Indian land where the agency owns the renewable energy attributes.Off-site renewable energy: Includes both the renewable attributes (RECs) and the source electricity for the renewable attributes.
Renewable energy certificate (REC) purchases: A REC is a market-based instrument representing the right to the environmental, social, and other non-power attributes of renewable energy generation, with one REC representing those attributes for 1 MWh of electricity generated. RECs can be either sold together with the physical electricity generated or sold as a separate attribute. Agencies are able to purchase RECs to help achieve their renewable energy goals.
Direct bonus and REC replacement: When renewable energy is produced on federal or Indian land and the agency owns the renewable attribute, it is referred to as on-site renewable energy, and allows the agency to claim a bonus toward their renewable energy goal. An agency can own the project and RECs directly, or, if the agency gives up ownership of the RECs to another party, it can purchase replacement RECs to reclaim the bonus.
On-Site Renewable Energy Trends
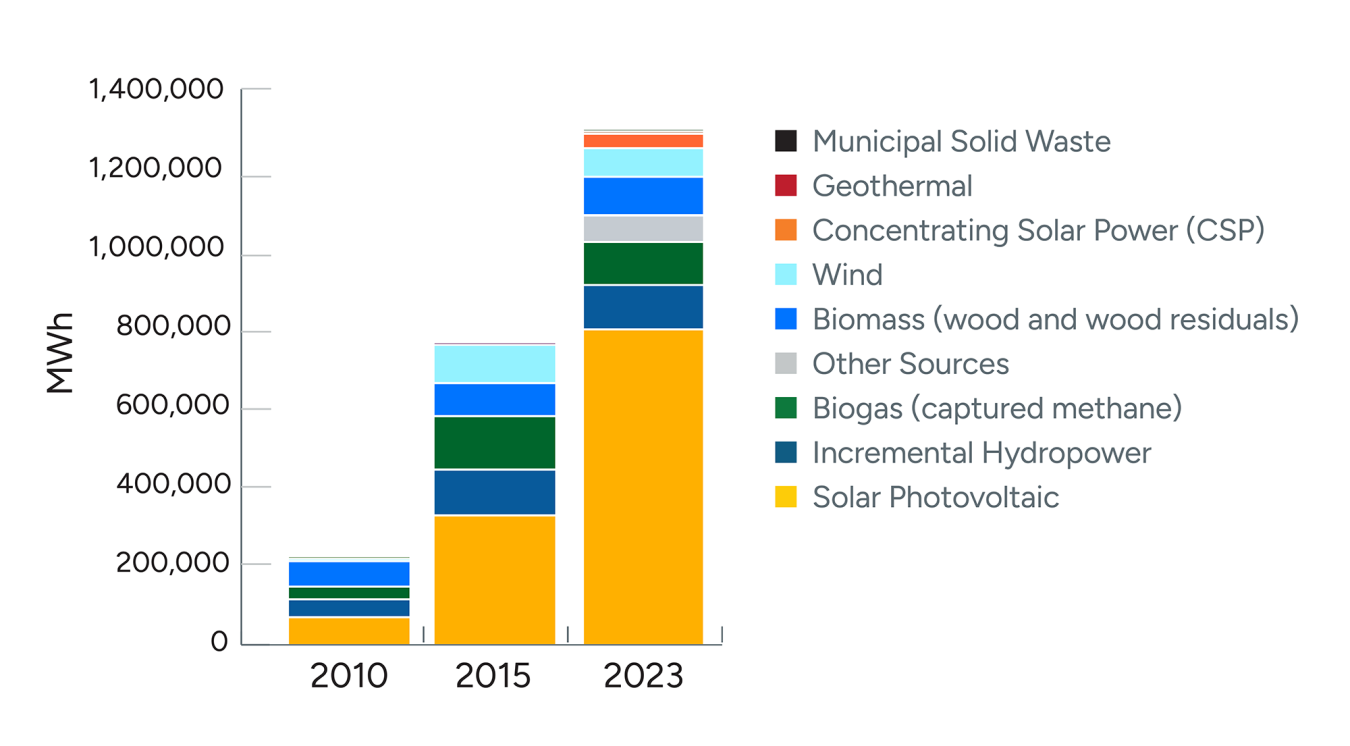
In FY 2023, federal agencies used 1.34 million MWh of renewable electricity from on-site renewable energy projects—nearly 2 times more than in FY 2015, and 6 times more than in FY 2010.
On-Site Renewable Energy (MWh) FY 2010 FY 2015 FY 2023 Solar Photovoltaic 70,488 322,714 805,182 Incremental Hydropower 42,744 108,708 136,907 Biogas (captured methane) 34,340 134,829 109,231 Other Sources 11,928 437 108,113 Biomass (wood and wood residuals) 40 77,513 100,907 Wind 59,266 94,135 76,015 Concentrating Solar Power 252 254 4,175 Geothermal 2,069 30 31 Municipal Solid Waste 5,375 0 0 Totals (MWh): 221,127 738,620 1,340,560
FY 2023 On-Site Solar Energy Generation
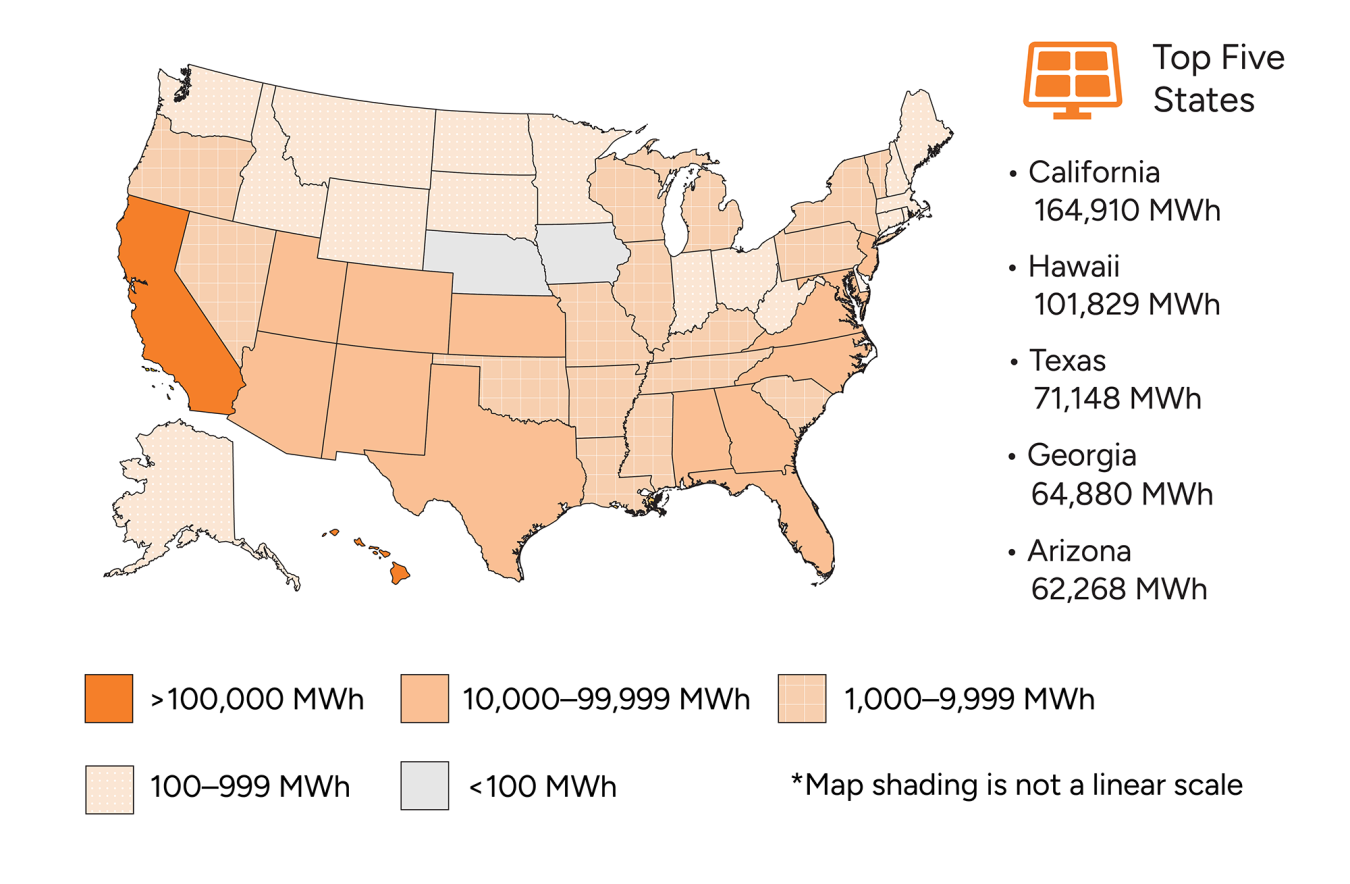
In FY 2023, federal agencies generated 805,182 MWh of renewable electricity with on-site solar energy projects. The top five states for federal on-site solar energy generation were California (164,910 MWh), Hawaii (101,829 MWh), Texas (71,148 MWh), Georgia (64,880 MWh), and Arizona (62,268 MWh). Solar generation is grouped into ranges in the map below.
FY 2023 On-Site Wind Energy Generation
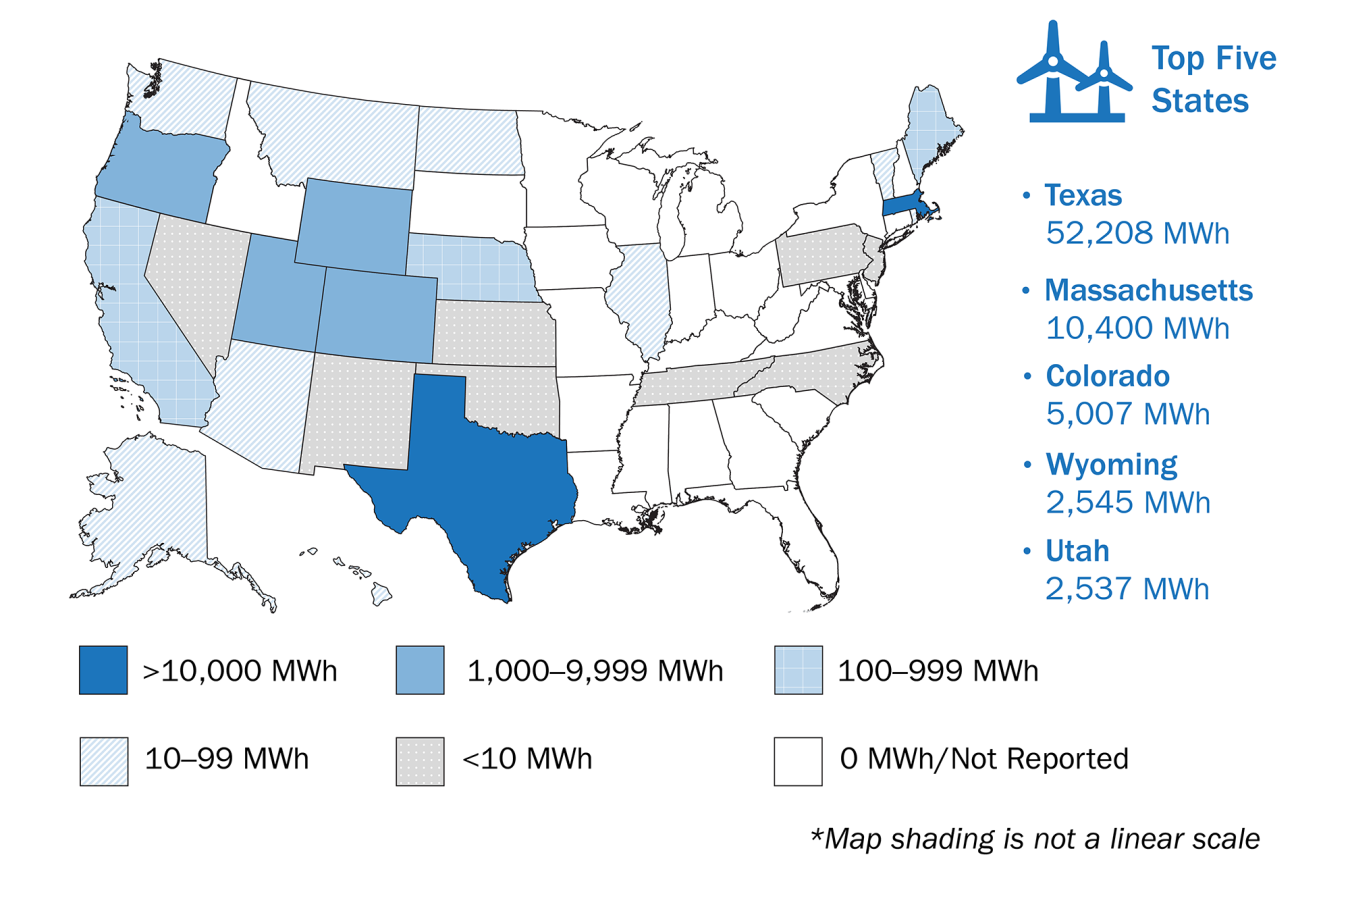
In FY 2023, federal agencies generated 76,015 MWh of renewable electricity with on-site wind energy projects. The top five states for federal on-site wind energy generation were Texas (52,208 MWh), Massachusetts (10,400 MWh), Colorado (5,007 MWh), Wyoming (2,545 MWh), and Utah (2,537 MWh). Wind generation is grouped into ranges in the map below.


