
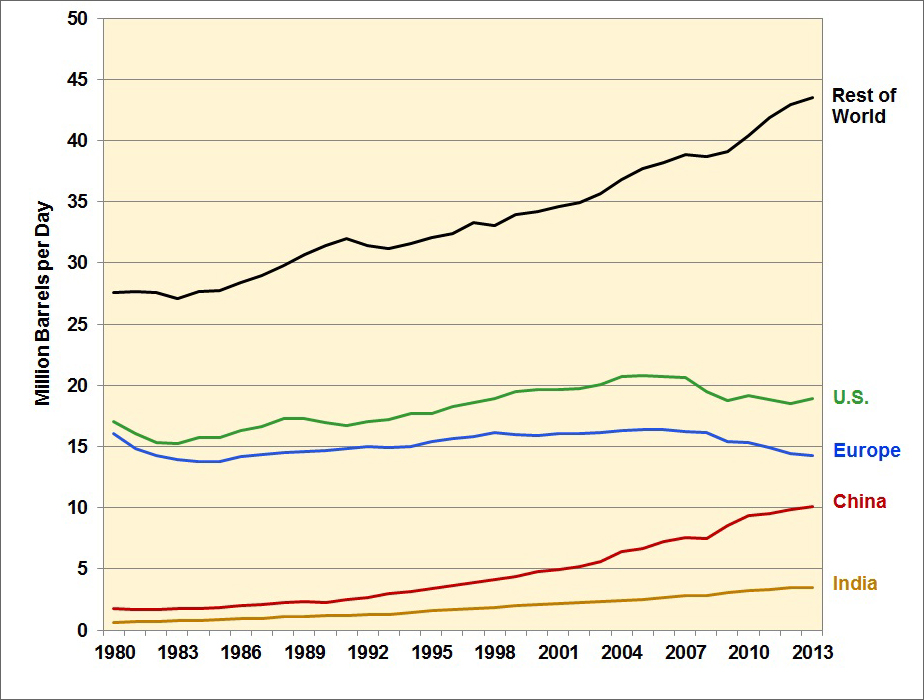
From 1980 to 2013, overall world petroleum consumption has increased from 63 to 90 million barrels per day. Overall consumption is the total of the individual countries/regions shown below. Although petroleum consumption in the U.S. and Europe has declined since 2007, this is offset by increasing consumption from the rest of the world. China has seen a rapid increase in petroleum consumption over the last decade while India has experienced a gradual rise in petroleum consumption. Not including the U.S., Europe, China, and India, petroleum consumption by the rest of the world has increased by 12.4% from 2008 to 2013.
Petroleum Consumption for Selected Countries/Regions, 1980-2013
Image
Supporting Information
| Year | (Million barrels per day) | |||||
|---|---|---|---|---|---|---|
| United States | Europe | China | India | Rest of World | World Total | |
| 1980 | 17.06 | 16.06 | 1.77 | 0.64 | 27.60 | 63.12 |
| 1981 | 16.06 | 14.80 | 1.71 | 0.73 | 27.66 | 60.95 |
| 1982 | 15.30 | 14.29 | 1.66 | 0.74 | 27.57 | 59.55 |
| 1983 | 15.23 | 13.93 | 1.73 | 0.77 | 27.12 | 58.78 |
| 1984 | 15.73 | 13.82 | 1.74 | 0.82 | 27.69 | 59.80 |
| 1985 | 15.73 | 13.79 | 1.89 | 0.89 | 27.79 | 60.08 |
| 1986 | 16.28 | 14.19 | 2.00 | 0.95 | 28.40 | 61.82 |
| 1987 | 16.67 | 14.33 | 2.12 | 0.99 | 29.00 | 63.11 |
| 1988 | 17.28 | 14.52 | 2.27 | 1.08 | 29.82 | 64.98 |
| 1989 | 17.33 | 14.56 | 2.38 | 1.15 | 30.68 | 66.09 |
| 1990 | 16.99 | 14.69 | 2.30 | 1.17 | 31.40 | 66.55 |
| 1991 | 16.71 | 14.80 | 2.50 | 1.19 | 32.01 | 67.21 |
| 1992 | 17.03 | 14.97 | 2.66 | 1.27 | 31.45 | 67.38 |
| 1993 | 17.24 | 14.93 | 2.96 | 1.31 | 31.15 | 67.59 |
| 1994 | 17.72 | 15.04 | 3.16 | 1.41 | 31.59 | 68.93 |
| 1995 | 17.72 | 15.39 | 3.36 | 1.57 | 32.08 | 70.13 |
| 1996 | 18.31 | 15.69 | 3.61 | 1.68 | 32.42 | 71.71 |
| 1997 | 18.62 | 15.85 | 3.92 | 1.77 | 33.31 | 73.46 |
| 1998 | 18.92 | 16.15 | 4.11 | 1.84 | 33.10 | 74.12 |
| 1999 | 19.52 | 16.02 | 4.36 | 2.03 | 33.94 | 75.88 |
| 2000 | 19.70 | 15.92 | 4.80 | 2.13 | 34.24 | 76.79 |
| 2001 | 19.65 | 16.10 | 4.92 | 2.18 | 34.63 | 77.48 |
| 2002 | 19.76 | 16.06 | 5.16 | 2.26 | 34.97 | 78.22 |
| 2003 | 20.03 | 16.16 | 5.58 | 2.35 | 35.70 | 79.81 |
| 2004 | 20.73 | 16.28 | 6.44 | 2.43 | 36.79 | 82.67 |
| 2005 | 20.80 | 16.40 | 6.70 | 2.51 | 37.74 | 84.15 |
| 2006 | 20.69 | 16.42 | 7.26 | 2.69 | 38.21 | 85.27 |
| 2007 | 20.68 | 16.24 | 7.53 | 2.80 | 38.83 | 86.09 |
| 2008 | 19.50 | 16.15 | 7.47 | 2.86 | 38.72 | 84.70 |
| 2009 | 18.77 | 15.38 | 8.54 | 3.11 | 39.12 | 84.92 |
| 2010 | 19.18 | 15.34 | 9.33 | 3.26 | 40.42 | 87.53 |
| 2011 | 18.88 | 14.93 | 9.50 | 3.28 | 41.89 | 88.49 |
| 2012 | 18.49 | 14.42 | 9.87 | 3.45 | 42.93 | 89.16 |
| 2013 | 18.89 | 14.30 | 10.12 | 3.51 | 43.52 | 90.33 |
| Source: Energy Information Administration, International Energy Statistics, accessed August 2014. | ||||||