
Electric vehicles do not create emissions from a tailpipe like conventional vehicles do. The electricity used to fuel electric vehicles is generated at power plants all across the nation. Because each plant that generates electricity can use a different mix of energy sources, the emissions associated with electric vehicle charging can vary significantly depending on where the vehicle's electricity is generated. For more specifics on electric vehicle upstream emissions, see Fact of the Week #737, July 23, 2012.
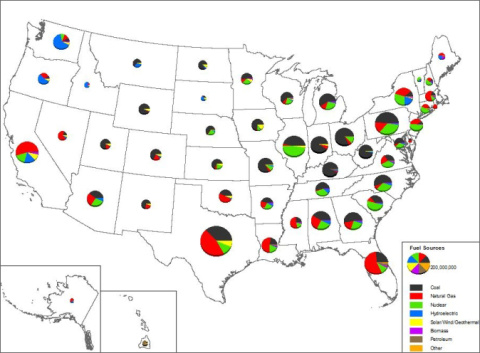
Electricity is generated from many different sources, with the most prevalent being coal, natural gas, nuclear and hydroelectric. The size of the pie charts on the map below indicates how much electricity is generated within that State and the pie slices show the sources used to generate that electricity. More than half of the electricity is generated by natural gas in seven States – Alaska, California, Connecticut, Delaware, Florida, Louisiana, Massachusetts, Mississippi, Nevada and Rhode Island. In Idaho, Oregon, South Dakota and Washington State, more than half of the electricity is generated by hydroelectric means. Though coal-producing States, such as West Virginia, Kentucky, and Wyoming use mainly coal to produce electricity, more than half of the States (29 States and the District of Columbia) produce less than half of their electricity from coal.
Electricity Generation by Source and State, 2010
Image
Supporting Information
| State | Source | Total | Total Generation (Thousand Megawatt-hours) | |||||||
|---|---|---|---|---|---|---|---|---|---|---|
| Coal | Petroleum | Natural Gas | Nuclear | Hydro- electric | Solar/Wind/ Geothermal | Biomass | Other | |||
| AK | 9.2% | 13.9% | 55.5% | 0.0% | 21.2% | 0.2% | 0.1% | 0.0% | 100.0% | 6,759,575 |
| AL | 41.4% | 0.1% | 26.0% | 24.9% | 5.7% | 0.0% | 1.6% | 0.2% | 100.0% | 152,150,512 |
| AR | 46.2% | 0.1% | 20.4% | 0.0% | 24.6% | 6.0% | 2.7% | 0.0% | 100.0% | 61,000,184 |
| AZ | 39.1% | 0.1% | 26.6% | 27.9% | 5.9% | 0.1% | 0.2% | 0.2% | 100.0% | 111,750,957 |
| CA | 1.0% | 0.5% | 53.5% | 15.8% | 16.4% | 9.5% | 2.9% | 0.3% | 100.0% | 204,125,595 |
| CO | 68.1% | 0.0% | 21.8% | 0.0% | 3.1% | 6.9% | 0.1% | -0.1% | 100.0% | 50,720,793 |
| CT | 7.8% | 1.2% | 50.2% | 1.2% | 35.2% | 0.0% | 2.2% | 2.2% | 100.0% | 33,349,623 |
| DC | 0.0% | 100.0% | 0.0% | 0.0% | 0.0% | 0.0% | 0.0% | 0.0% | 100.0% | 199,858 |
| DE | 45.6% | 1.0% | 50.9% | 0.0% | 0.0% | 0.0% | 2.4% | 0.0% | 100.0% | 5,627,645 |
| FL | 26.1% | 4.0% | 56.2% | 10.4% | 0.1% | 0.0% | 1.9% | 1.2% | 100.0% | 229,095,935 |
| GA | 53.3% | 0.5% | 17.4% | 24.4% | 2.4% | 0.0% | 2.3% | -0.2% | 100.0% | 137,576,942 |
| HI | 14.3% | 74.6% | 0.2% | 0.0% | 0.6% | 4.3% | 2.6% | 3.4% | 100.0% | 10,836,036 |
| IA | 71.8% | 0.3% | 2.3% | 7.7% | 1.6% | 15.9% | 0.3% | 0.0% | 100.0% | 57,508,720 |
| ID | 0.7% | 0.0% | 14.0% | 0.0% | 76.1% | 4.3% | 4.2% | 0.7% | 100.0% | 12,024,564 |
| IL | 46.5% | 0.1% | 2.9% | 47.8% | 0.1% | 2.2% | 0.3% | 0.1% | 100.0% | 201,351,871 |
| IN | 89.7% | 0.1% | 6.9% | 0.0% | 0.4% | 2.3% | 0.2% | 0.3% | 100.0% | 125,180,738 |
| KS | 67.8% | 0.2% | 4.8% | 19.9% | 0.0% | 7.1% | 0.1% | 0.0% | 100.0% | 47,923,763 |
| KY | 92.7% | 2.3% | 1.9% | 0.0% | 2.6% | 0.0% | 0.4% | 0.0% | 100.0% | 98,217,657 |
| LA | 23.3% | 3.2% | 51.4% | 18.1% | 1.1% | 0.0% | 2.4% | 0.5% | 100.0% | 102,884,941 |
| MA | 19.4% | 0.7% | 59.8% | 13.8% | 2.3% | 0.1% | 2.9% | 1.0% | 100.0% | 42,804,824 |
| MD | 54.3% | 0.7% | 7.1% | 32.1% | 3.8% | 0.0% | 1.3% | 0.6% | 100.0% | 43,607,264 |
| ME | 0.5% | 1.6% | 49.2% | 0.0% | 22.4% | 2.9% | 21.5% | 1.9% | 100.0% | 17,018,659 |
| MI | 58.8% | 0.3% | 11.2% | 26.6% | 1.1% | 0.3% | 2.2% | -0.6% | 100.0% | 111,551,372 |
| MN | 52.3% | 0.1% | 8.1% | 25.1% | 1.6% | 8.9% | 3.4% | 0.5% | 100.0% | 53,670,228 |
| MO | 81.3% | 0.1% | 5.1% | 9.7% | 1.7% | 1.0% | 0.1% | 1.0% | 100.0% | 92,312,990 |
| MS | 25.0% | 0.1% | 54.4% | 17.7% | 0.0% | 0.0% | 2.8% | 0.0% | 100.0% | 54,487,261 |
| MT | 62.4% | 1.4% | 0.2% | 0.0% | 31.6% | 3.1% | 0.3% | 0.9% | 100.0% | 29,791,179 |
| NC | 55.9% | 0.2% | 6.6% | 31.7% | 3.7% | 0.0% | 1.6% | 0.3% | 100.0% | 128,678,484 |
| ND | 81.9% | 0.1% | 0.1% | 5.9% | 0.0% | 11.8% | 0.0% | 0.1% | 100.0% | 34,739,542 |
| NE | 63.8% | 0.1% | 1.0% | 30.2% | 3.6% | 1.2% | 0.2% | 0.0% | 100.0% | 36,630,006 |
| NH | 13.9% | 0.3% | 24.2% | 49.2% | 6.7% | 0.3% | 5.2% | 0.3% | 100.0% | 22,195,912 |
| NJ | 9.8% | 0.4% | 38.1% | 49.9% | 0.0% | 0.1% | 1.2% | 0.6% | 100.0% | 65,682,494 |
| NM | 70.7% | 0.1% | 23.5% | 0.0% | 0.6% | 5.1% | 0.0% | 0.0% | 100.0% | 36,251,543 |
| NV | 19.9% | 0.0% | 67.4% | 0.0% | 6.1% | 0.0% | 6.5% | 0.0% | 100.0% | 35,146,247 |
| NY | 9.9% | 1.5% | 35.7% | 30.6% | 18.6% | 1.9% | 1.6% | 0.2% | 100.0% | 136,961,653 |
| OH | 82.1% | 1.0% | 11.0% | 0.3% | 5.1% | 0.0% | 0.5% | 0.0% | 100.0% | 143,598,337 |
| OK | 43.6% | 0.0% | 3.9% | 0.0% | 5.3% | 47.0% | 0.5% | -0.2% | 100.0% | 72,250,733 |
| OR | 7.5% | 0.0% | 28.4% | 0.0% | 55.4% | 7.1% | 1.5% | 0.1% | 100.0% | 55,126,999 |
| PA | 48.0% | 0.2% | 14.9% | 33.9% | 1.0% | 0.8% | 1.0% | 0.1% | 100.0% | 229,752,307 |
| RI | 0.0% | 0.2% | 98.0% | 0.0% | 0.0% | 0.0% | 1.8% | 0.0% | 100.0% | 7,738,719 |
| SC | 36.2% | 0.2% | 10.5% | 49.9% | 2.3% | 0.0% | 1.8% | -0.8% | 100.0% | 104,153,132 |
| SD | 32.8% | 0.1% | 1.3% | 0.0% | 52.1% | 13.6% | 0.0% | 0.0% | 100.0% | 10,049,637 |
| TN | 53.0% | 0.3% | 2.8% | 33.7% | 9.9% | 0.0% | 1.1% | -0.9% | 100.0% | 82,348,624 |
| TX | 36.5% | 0.2% | 46.2% | 10.0% | 0.3% | 6.4% | 0.4% | 0.1% | 100.0% | 411,695,046 |
| UT | 76.0% | 0.1% | 14.5% | 0.0% | 1.6% | 7.4% | 0.1% | 0.4% | 100.0% | 44,837,624 |
| VA | 34.9% | 1.8% | 23.3% | 36.4% | 2.1% | 0.0% | 3.0% | -1.5% | 100.0% | 72,966,456 |
| VT | 0.0% | 0.1% | 0.1% | 72.2% | 20.3% | 0.2% | 7.1% | 0.0% | 100.0% | 6,619,991 |
| WA | 8.2% | 0.0% | 10.3% | 8.9% | 66.0% | 4.6% | 1.8% | 0.1% | 100.0% | 103,472,730 |
| WI | 62.5% | 1.1% | 8.5% | 20.7% | 3.3% | 1.7% | 2.2% | 0.1% | 100.0% | 64,314,068 |
| WV | 96.7% | 0.2% | 0.2% | 0.0% | 1.7% | 1.2% | 0.0% | 0.0% | 100.0% | 80,788,947 |
| WY | 89.3% | 0.1% | 1.5% | 0.0% | 2.1% | 6.7% | 0.0% | 0.1% | 100.0% | 48,119,254 |
| Total | 44.8% | 0.9% | 23.8% | 18.5% | 7.0% | 3.5% | 1.4% | 0.2% | 100.0% | 4,127,648,171 |
Note: The Energy Information Administration collects information from all electric generating facilities in the U.S. with a capacity of 1 or more megawatts. | ||||||||||