
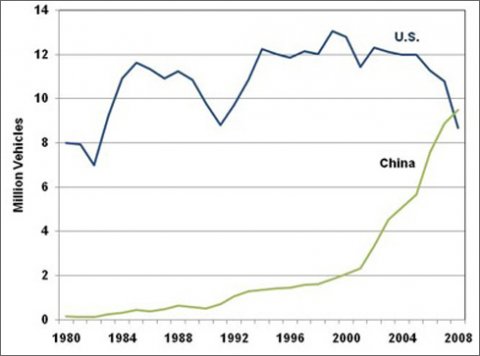
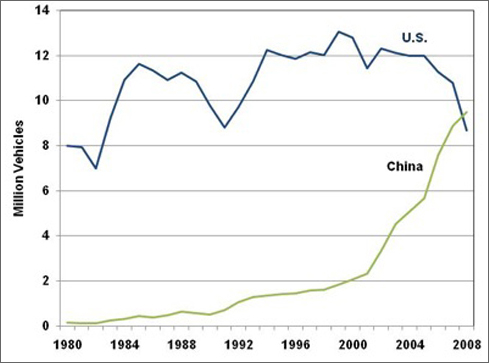
In 1980, the U.S. produced 56 times more vehicles than China. China's vehicle production has been growing since then, while U.S. vehicle production was hit hard in the recent economic downturn. In the year 2008, China produced 9.5 million vehicles, while the U.S. produced 8.7 million vehicles.
Vehicles Produced in the U.S. and China, 1980-2008
Image
Image
Supporting Information
| Year | U.S. | China |
|---|---|---|
| 1980 | 8.01 | 0.14 |
| 1981 | 7.94 | 0.11 |
| 1982 | 6.99 | 0.13 |
| 1983 | 9.22 | 0.24 |
| 1984 | 10.92 | 0.32 |
| 1985 | 11.65 | 0.44 |
| 1986 | 11.34 | 0.37 |
| 1987 | 10.93 | 0.47 |
| 1988 | 11.24 | 0.65 |
| 1989 | 10.87 | 0.59 |
| 1990 | 9.78 | 0.51 |
| 1991 | 8.81 | 0.71 |
| 1992 | 9.71 | 1.06 |
| 1993 | 10.87 | 1.30 |
| 1994 | 12.26 | 1.35 |
| 1995 | 12.01 | 1.43 |
| 1996 | 11.85 | 1.46 |
| 1997 | 12.15 | 1.58 |
| 1998 | 12.03 | 1.63 |
| 1999 | 13.05 | 1.83 |
| 2000 | 12.80 | 2.07 |
| 2001 | 11.45 | 2.33 |
| 2002 | 12.30 | 3.34 |
| 2003 | 12.12 | 4.55 |
| 2004 | 11.99 | 5.07 |
| 2005 | 11.98 | 5.67 |
| 2006 | 11.29 | 7.57 |
| 2007 | 10.78 | 8.89 |
| 2008 | 8.70 | 9.51 |
Source: Ward's Automotive Group, Ward's World Motor Vehicle Data 2009, Southfield, MI, 2009. | ||